In addition to player and team shooting statistics, which are often displayed on curling TV telecasts, another set of statistics common to curling are scoring metrics that summarize a team’s ability to capitalize on last rock advantage, steal points in ends where they don’t have last rock, and their ability to defend against team(s) when the opposition has last rock. These are relatively rudimentary performance metrics, but they can offer some insight to a team’s performance.
If one is using the Curl Coach app to chart games those summary scoring metrics are shown on the main Competition page within the app – regrettably these statistics are not duplicated in the generated Competition Report PDF. An example of these statistics captured with Curl Coach appears at right.
In addition to the base statistics shown for this competition: number of games played, wins and losses, average points scored for/against, etc. there are a number of additional metrics, such as Hammer Efficiency (called Hammer Conversion by Curl Coach), that are shown as well. These metrics, usually expressed as percentages but for convenience are sometimes given as numeric values to 2 decimal places, are fairly well-known in curling circles but may be unfamiliar to new coaches. These metrics are documented by Kevin Palmer in this November 2018 article on Kevin’s Curl With Math site. For convenience, I have also included them here. They are, briefly:
- Hammer Efficiency (HE) – the percentage of time a team takes 2 or more points when they have last rock advantage, in ends which are scored (ie. when the end is completed and the result is not an “X”). The ratio includes all non-blank ends in which a team has hammer.
- Force Efficiency (FE) – measures the ability of a team to force their opponent to one point when the opposition has hammer. Again expressed as a percentage, FE is calculated by number of ends in which the opponent took 1 point divided by all ends against without hammer where the opponent scores. Stolen and blank ends are not included in the calculation.
- Steal Efficiency (SE) – the percentage of ends a team is able to steal. Steal efficiency is calculated by dividing the number of ends stolen (i.e. without hammer) by the total ends played without hammer. Blank ends are included.
- Steal Defence (SD) characterizes a team’s ability to limit the number of stolen ends against. It is calculated by number of ends stolen against divided by number of ends with hammer. As with Steal Efficiency, blank ends are included in the result.
- Hammer Factor (HF) (sometimes known as With Hammer Factor) is a combined, single metric that characterizes a team’s performance when they have last rock advantage. It is computed using the formula HF = HE – SD, in other words the subtraction of Steal Defence from Hammer Efficiency.
- Without Hammer Factor (WHF) – Similar to Hammer Factor, this is a single metric that characterizes a team’s performance when the team does not have last rock. Mathematically, WHF is computed using the equation WHF = FE + SE, in other words the sum of Force Efficiency and Steal Efficiency.
- Combined Team Index (CTI) – the combination of Hammer Factor minus the Without Hammer Factor to get a single metric, mathematically CTI = HF – WHF.
While one can compute these metrics for an individual game, a larger sample size is necessary to get a sense of a team’s overall performance and style of play. Linking these metrics to shooting statistics can be enlightening for a coach and their team.
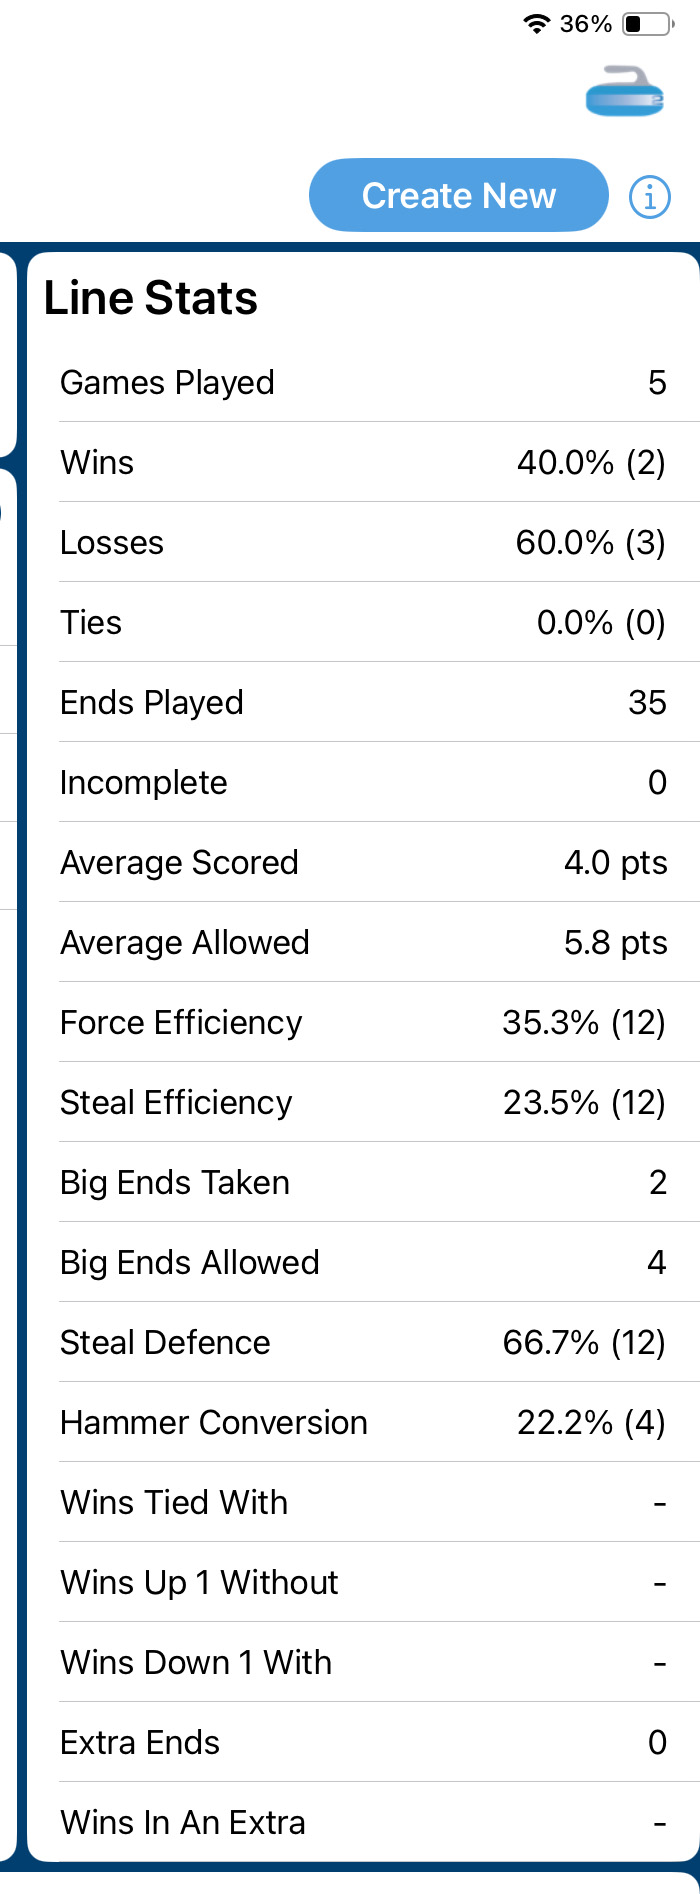
Competition summary statistics for a 5-game competition from Curl Coach. The team’s final record was 2-3.
Some context
In his 2018 article, Kevin Palmer notes that Hammer Factor (HF) is a good indicator of team quality as it combines the ability to score 2+ points when holding hammer, yet at the same time limiting the number of steals against. The WHF and CTI metrics, to my knowledge, were first proposed by Dale Neufeld in this recent article. While Hammer Factor is Kevin Palmer’s go-to metric, I think something can be learned from the Without Hammer Factor (WHF) as I think it is important and pertinent to many teams, especially at the U20 and U18 levels. CTI gives a single metric for a team’s performance by summing the values both with, and without, last rock advantage.
Dale Neufeld has proposed an additional metric that he terms Team Efficiency, which includes a team’s winning percentage (#wins/#games) along with the hammer and without hammer statistics. I think that adding a team’s winning percentage to their end-performance statistics is of questionable utility since a team with a good Hammer Factor is likely to win more often anyway, so the addition of winning percentage simply amplifies the result. I think the Team Efficiency metric may produce a small ranking effect in a set of results, but I’m not going to pursue the computation of that statistic in my subsequent analyses.
Athlete shooting statistics are influenced to a degree by the skill level of their opposition, since the degree of difficulty for each shot will depend on what the opponent leaves you after theirs. Hence shooting statistics can vary somewhat depending on the quality of the opponents that one plays. Similarly, one’s scoring metrics are also going to be influenced by the quality of the teams that one plays against. Moreover, in any particular event it is often the case that teams will play a different number of games, which again can skew the numbers. Nevertheless, determining your team’s scoring metrics can be a useful exercise and can lend some insight into your team’s performance and how they play compared to the teams they play against.
Computing the numbers
Thanks to Dave Rapin at curling.io, Curling Canada’s scoreboard, along with the other scoreboards from each of Canada’s provincial and territorial associations, offers easy-to-use statistics for computing scoring metrics.
The sample at right summarizes the statistics for the Ontario university women’s teams at last year’s 2025 OUA championships held in Sudbury at the Idlewyld Golf and Country Club. The scoring statistics are conveniently split by whether the team has last rock advantage (or not), making the computation of the scoring metrics described above fairly straightforward. This summary report by hammer is augmented by another scoring analysis page under the “Reports” menu that breaks down the points scored for-and-against, providing a fairly complete scoring breakdown for each team.
In contrast, unfortunately the event statistics provided by the Junior Slam Series site (see accompanying image at right) outlines the scoring summaries by points, but doesn’t break down scoring by hammer. Hence one has to look at individual games to compute the desired metrics. In addition, Curl Coach lumps end scores of 3+ all together, whereas curling.io separates end scores of 3, 4, and 5+.
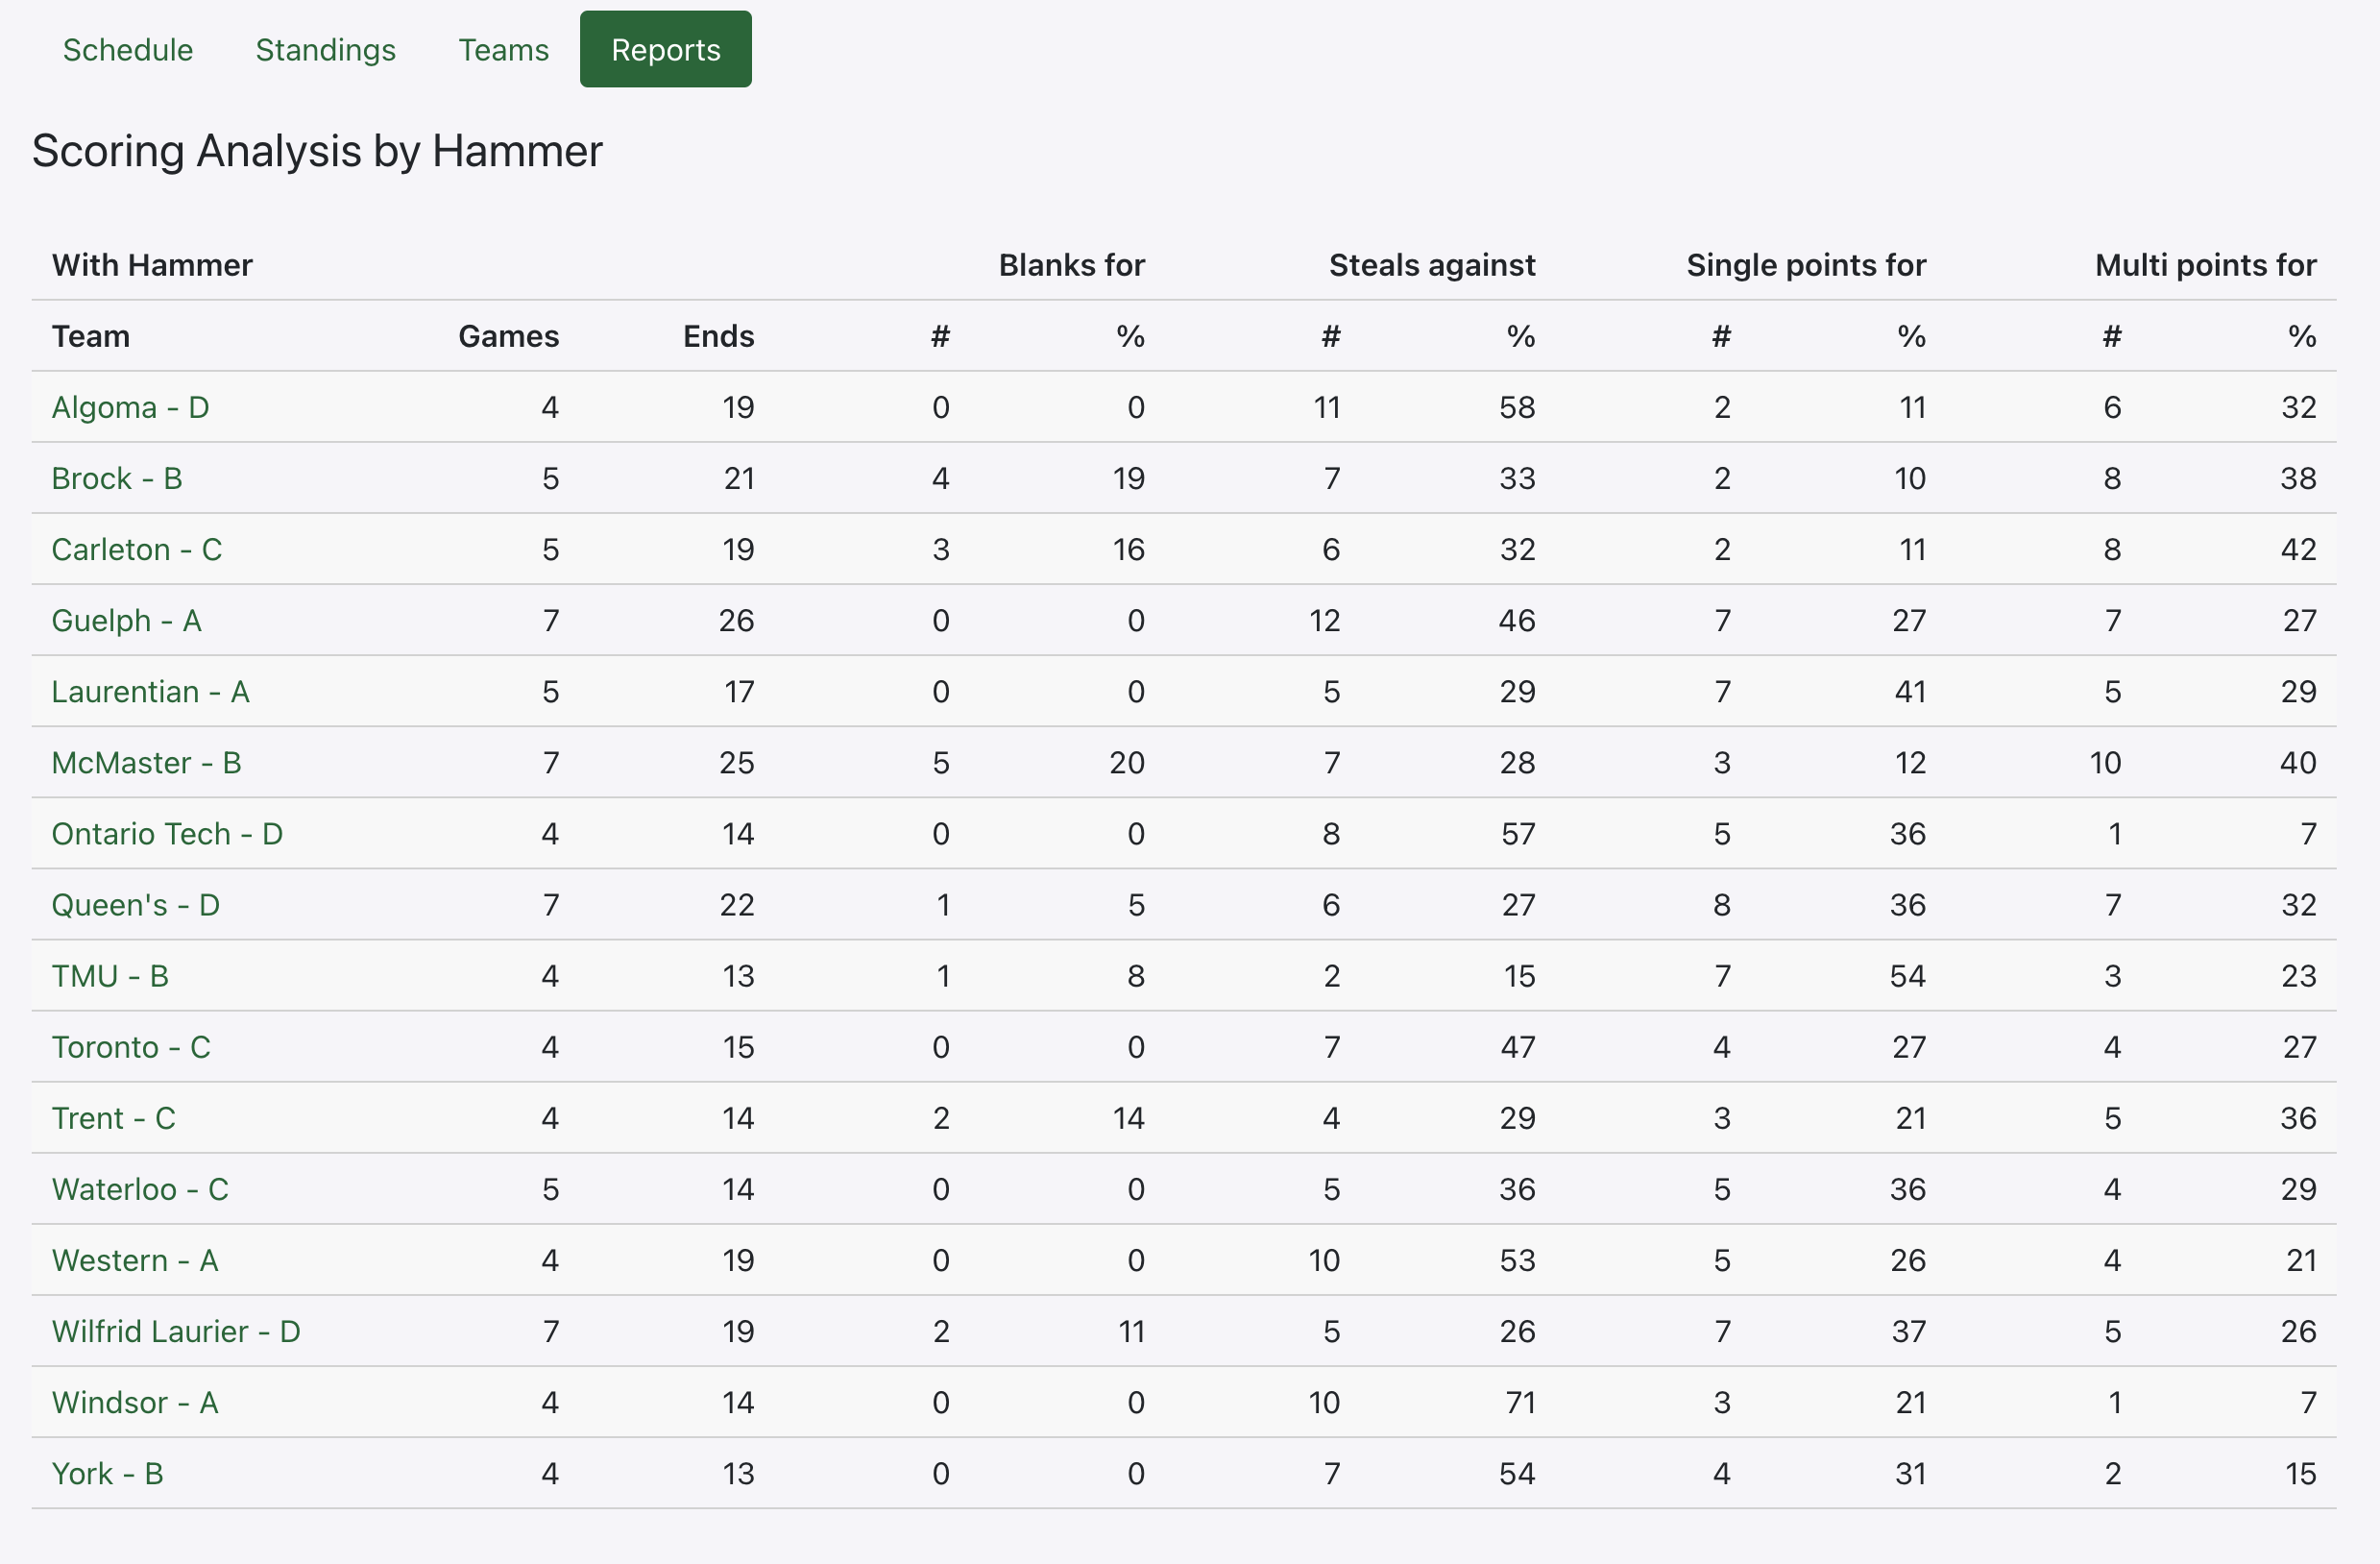
Scoring summary by hammer provided by Curling I/O.
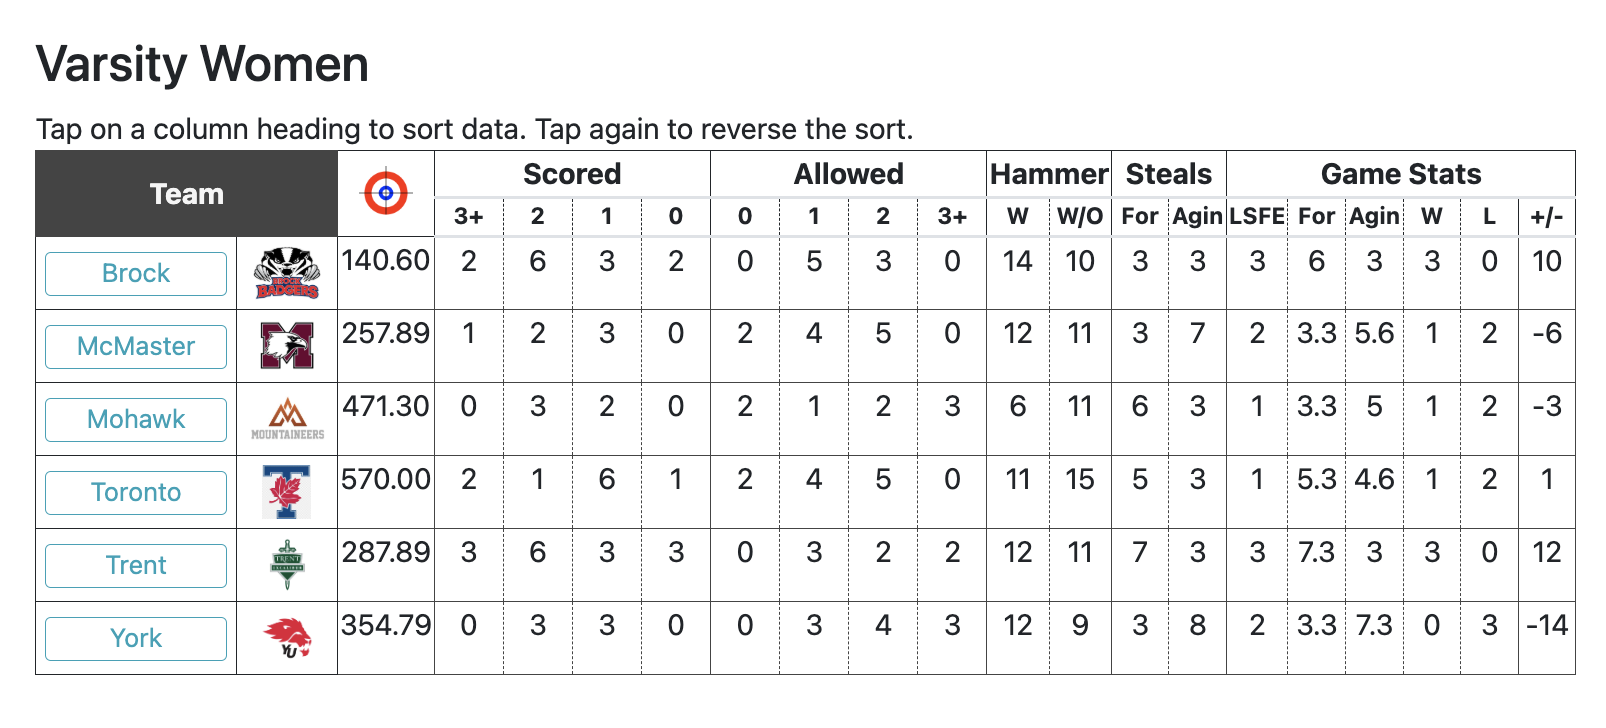
Scoring summary data provided by Curl Coach, for a different competition from the one above.
Summary
An immediate question that coaches should ask is what do the values actually mean. For example, if my team’s hammer efficiency is 37% (0.37), is that good? Average? Below average? What is a good value for Steal Defence? And so on.
As with shooting statistics, scoring metric analysis is another tools in a coach’s toolkit, but there is often considerable judgment required to get useful information from the data. Scoring metrics are not a panacea.
Most of the published statistics on the internet pertain to adult play, particularly teams that play in Grand Slam Tier 1 or Tier 2 events. If the reader is interested in values for U18, U20, or University-level teams one will likely have to do their own analysis.
In the next few articles in this series, I’ll go through a couple of recent Junior and University events and try to provide some context. Since the Ontario University Championships are coming up in February, I’ll begin with an analysis of last year’s 2025 OUA Women’s championship in Sudbury. Stay tuned.