A look at the 2025 OUA Women's University Curling Championships
In my previous article I outlined some basic curling scoring metrics, namely hammer efficiency, steal defence, steal efficiency, and force efficiency, and how they are computed for any particular team in a specific event. These four measures are routinely reported in the Curl Coach app and in Curling Zone event results. According to Curling Zone’s Gerry Geurts, the hammer efficiency metric was based on an idea first proposed by former Canadian champion and Olympian Linda Moore, who proposed that what percentage of time a team with last rock was actually able to score two points was a good measure of a team’s ability. Gerry, along with colleague Dallas Bittle, took that idea one step further and created the other metrics along similar lines. Subsequently, Hammer Factor, Without Hammer Factor, and a Combined Team Index were proposed that simply combined two or more of these elementary metrics.
In this article, I’m going to describe how these metrics can be used to analyze the results of an event to potentially arrive at some insights regarding team strategy. To do that, I’ll use last year’s women’s Ontario University Athletics (OUA) championships as a case study, appropriate since the Canada West and Atlantic university championships are being held this week and the 2026 OUA’s are coming up the first weekend in February at the Welland Curling Club.
The 2025 OUA Women's Championship
The 2024-2025 OUA women’s championship was held from January 31 to February 2, 2025 at the Idlewyld Golf and Country Club in Sudbury, Ontario. 16 university varsity teams participated, divided into four pools of four. Games were set as a cross-over between pools (Pool A played games against teams in Pool D, and Pool B teams played against Pool C teams). Pool winners plus the remaining four best teams across all pools formed the eight teams to play in the sudden death quarterfinals on the morning of February 2. Guelph, McMaster, Laurier, and Queen’s moved onto the semifinals, with McMaster defeating Guelph in their semi and Laurier defeating Queen’s in the other. McMaster, skipped by Rachel Steele, defeated Laurier’s Emma Artichuk in the final to earn the gold medal, and Guelph’s Jill Uniacke defeated Queen’s Mia Toner to take the bronze and the last of the three Ontario berths at the forthcoming Canadian U-Sport nationals.
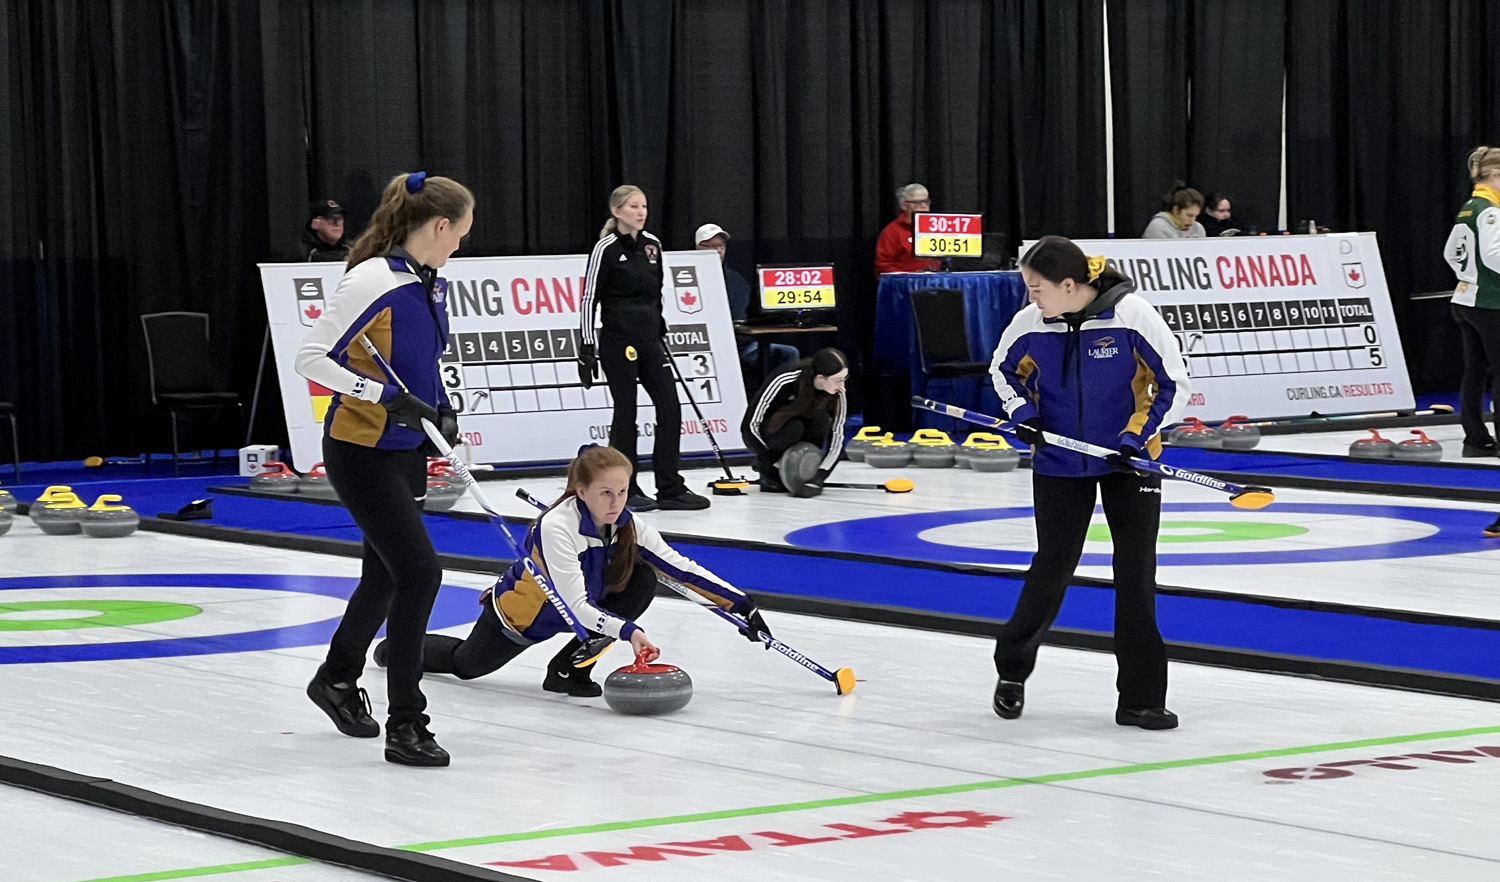
Emma McKenzie throws for Laurier at the 2022 FISU qualifier at the RA Centre in Ottawa.
There are several things regarding the championships that make analysis problematic. One is that the number of games is relatively few, so it’s not possible to argue statistical significance. Most of the teams only play against teams in their cross-pool matchups, rather than a full round-robin. Also teams play different numbers of games, with most teams playing 4 games, quarterfinalists playing 5, and playoff teams playing 7 (all games were 8 ends). Finally, unlike events like the Grand Slam or provincial men’s and women’s championships where teams qualify via CTRS points and are ranked based on their in-year performance, at OUAs each of the 16 schools can field a team, and rankings are based on the results of the previous year’s championship, regardless of the impact of athlete graduations. Together, what that means is that there is a much broader spectrum of quality across the field, and consequently a team’s scoring results can be skewed depending on the teams that they meet in pool play. Nevertheless, despite these confounding factors we’ll have a look at the scoring metrics for the event, beginning with hammer efficiency.
Hammer Efficiency
In Kevin Palmer’s 2018 article, he indicates that a Hammer Efficiency of 0.45 or greater is indicative of a good (or great) team; that is, at least 45% of the time the team will score at least two points when they have last rock advantage. Even though 2018 was before the advent of the 5-rock free guard zone (FGZ), it would appear that 0.45 remains a benchmark for teams on the Grand Slam tour, either men or women. Dale Neufeld’s statistical analysis of the 2024 RBC Dominion Securities Western Showdown is in good agreement with Kevin’s analysis. As another example, the median Hammer Efficiency at the 2025 Scotties championship was 0.38, with the winning rink (Rachel Homan) at 0.60. But what is a typical Hammer Efficiency for women’s university teams?
At right is a scatterplot (click on the image for a larger view) comparing Hammer Efficiency to each team’s corresponding points for/against ratio for the eight playoff teams from last year’s women’s OUAs. Three teams – Brock, McMaster, and Carleton – achieved Hammer Efficiency values of around 50%, whereas the other five playoff teams had Hammer Efficiency values in the 25%-32% range. Yet Laurier, with a Hammer Efficiency of just 0.29, had the highest for/against scoring ratio and finished the event with a 5-2 record, earning the silver medal with their loss to McMaster in the final.
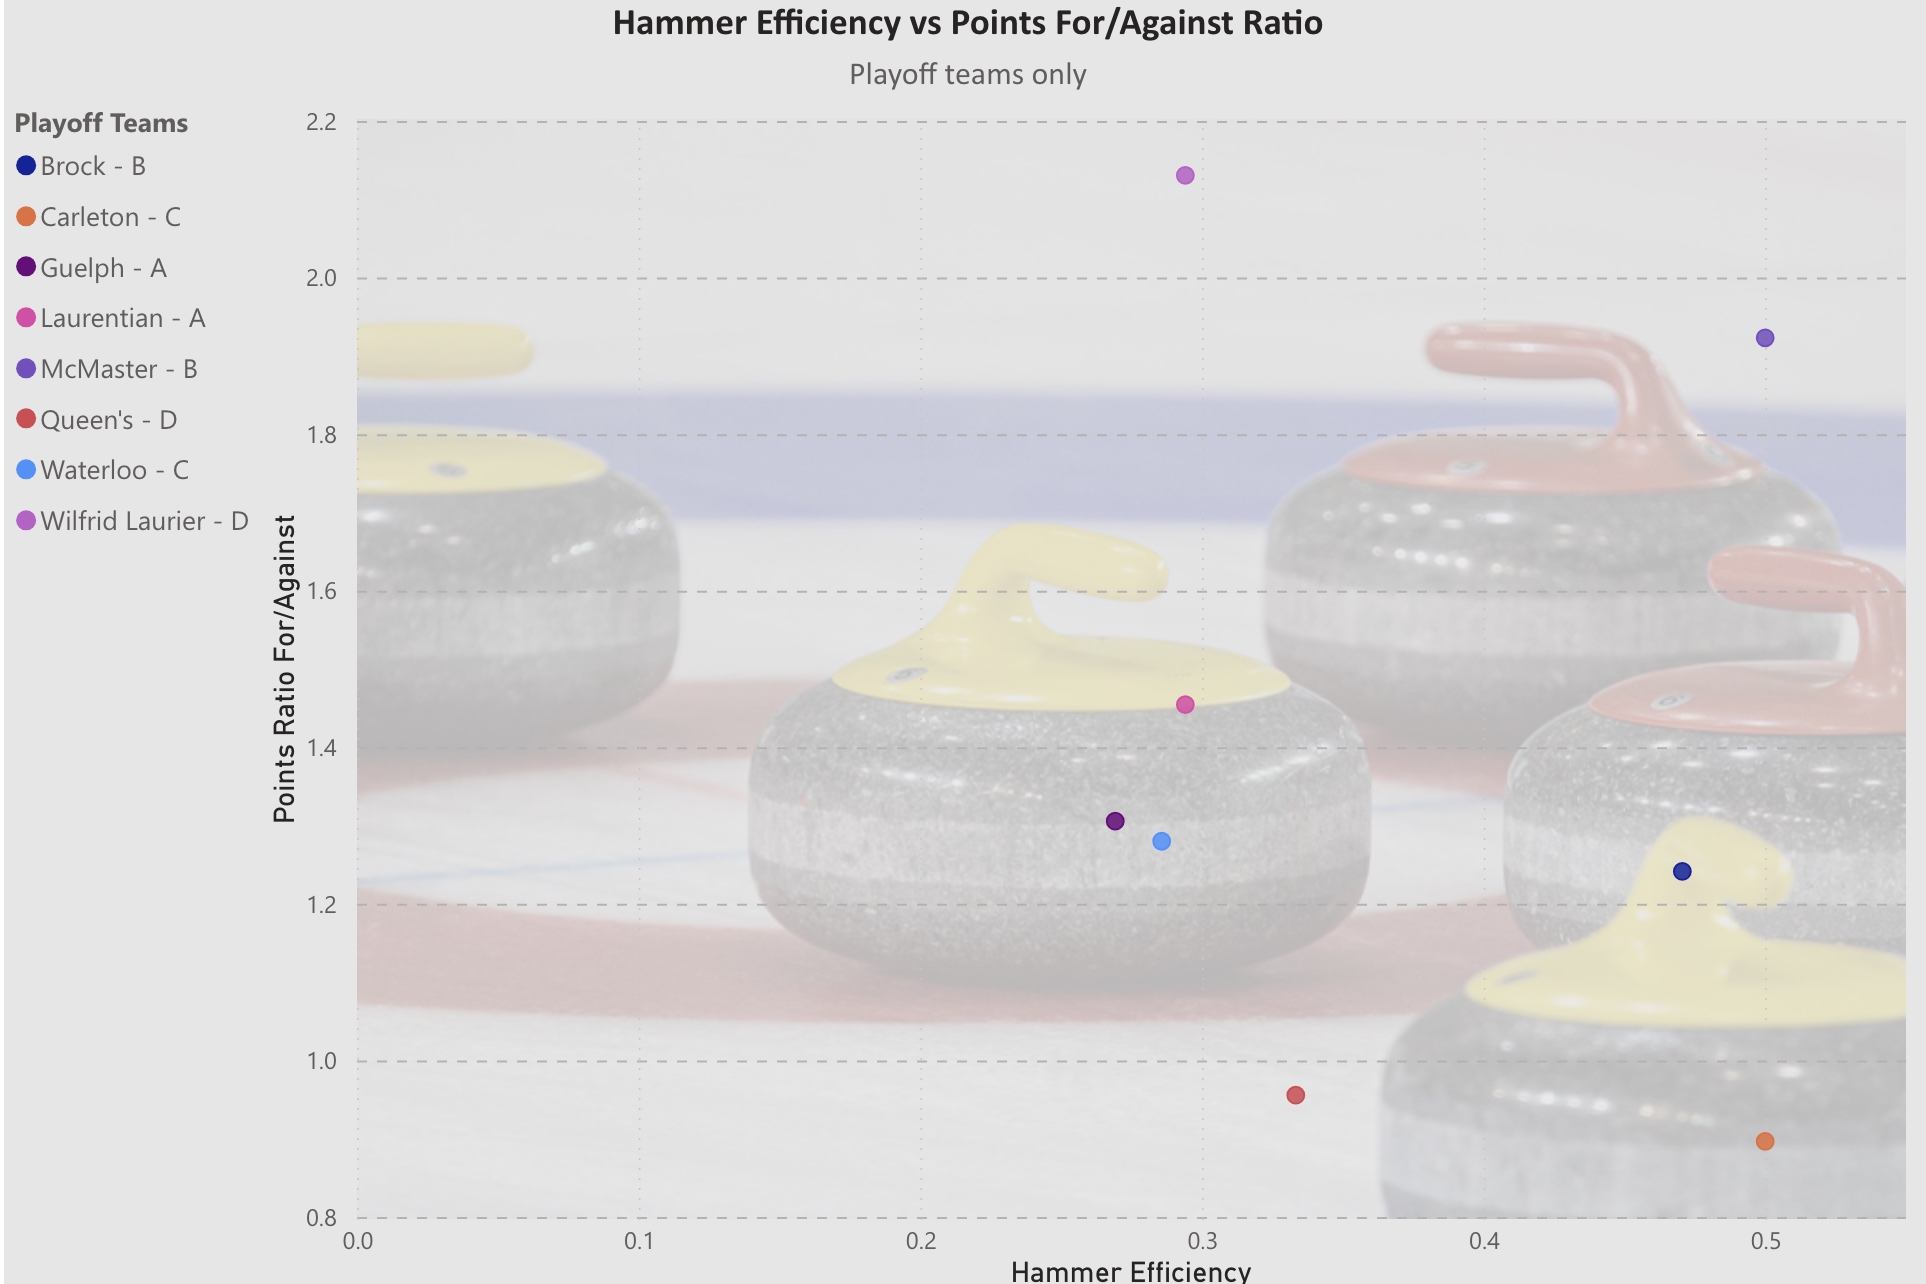
A scatter plot contrasting Hammer Efficiency to a team’s points for/against ratio. We use the ratio rather than absolute numbers since teams played different numbers of games.
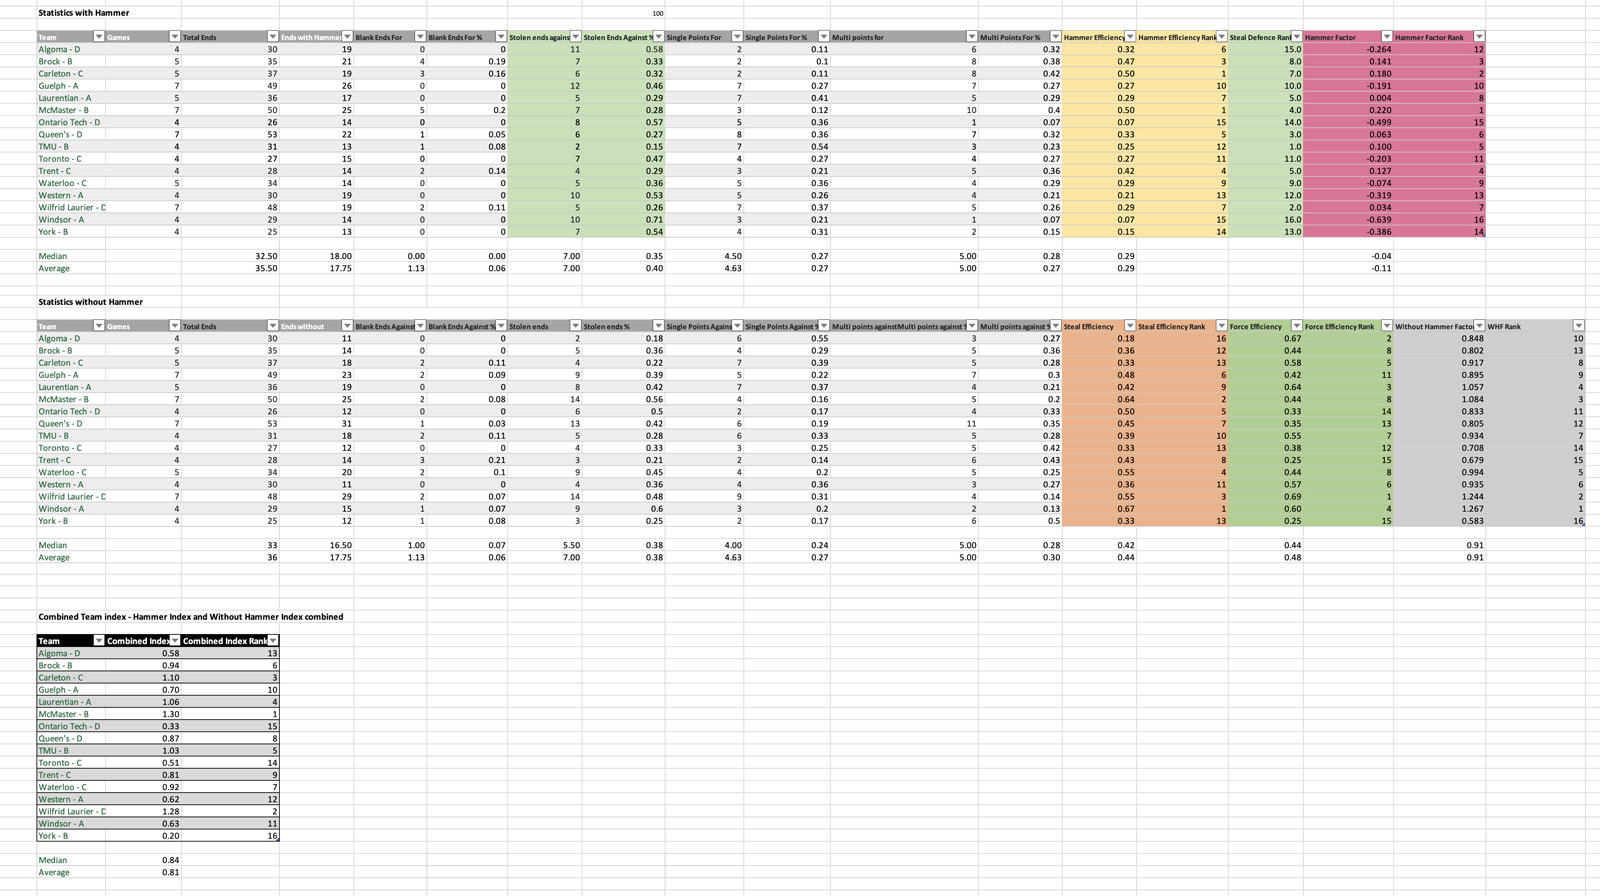
The reader should note, as can be seen in the spreadsheet, that teams enjoy last rock advantage approximately half of the time; for teams with winning records, the ratio is a little under 50% (since the team relinquishes hammer if they score) and teams with losing records tend to have last rock advantage a bit more than half the time. The reader can browse the spreadsheet to look at the Hammer Efficiency of the teams that did not make the quarterfinals.
The median Hammer Efficiency from last week’s 2026 Canada West Women’s University championships held at the Saville Centre in Edmonton was 0.26. However, the University of Alberta (skipped by Gracelynn Richards) had the highest Hammer Efficiency at 0.58, more than double that of runner-up Regina and easily the highest in the field. But as Laurier’s results showed, Hammer Efficiency alone doesn’t tell the entire story.
Steal Defence
Recall that the Steal Defence metric measures the frequency that the opposition steals at least one point over the total number of ends without hammer (hence, unlike Hammer Efficiency, a lower percentage is better).
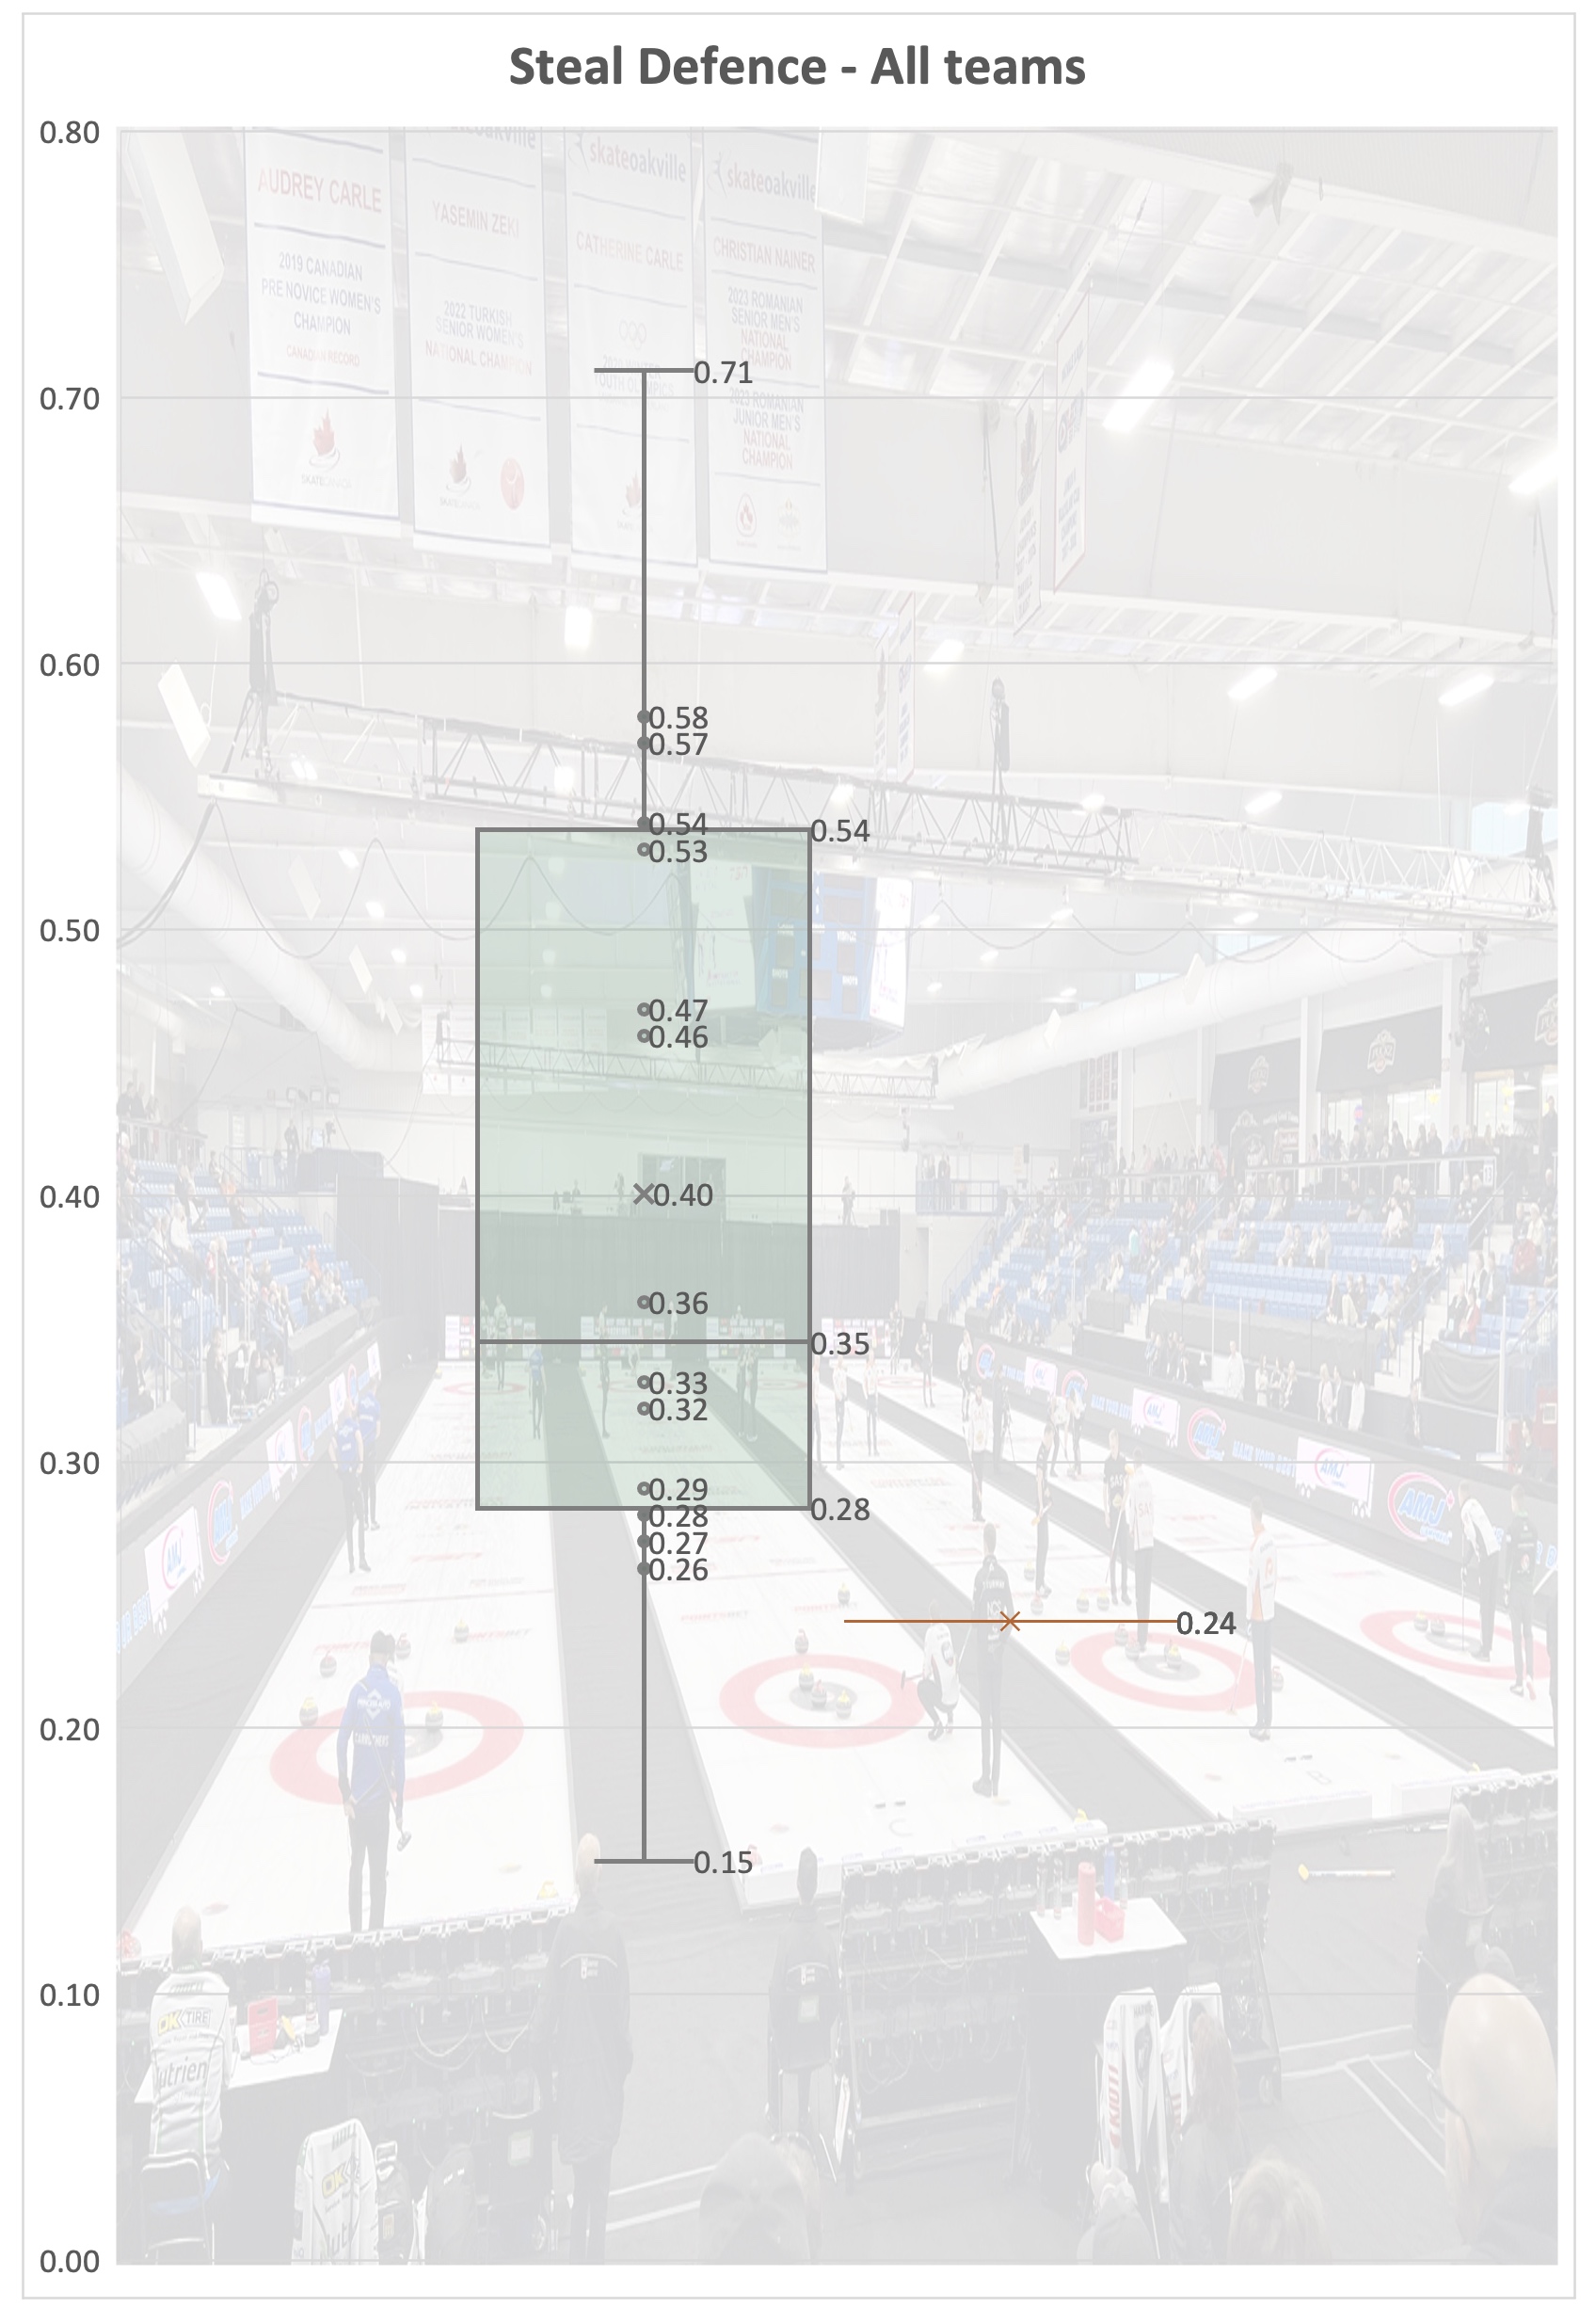
It is the Steal Defence metric that stands out as a significant difference between university-level teams and teams that compete at the Scotties. The chart at right documents the Steal Defence metric for all 16 teams, along with the red line of 24%, which is the median Steal Defence from the 2025 Scotties. At the 2025 OUAs, only Toronto Metropolitan University, with a miserly Steal Defence value of 0.15, was lower than the Scotties’ median.
There was a lot of stealing at OUAs. McMaster, for example, stole points in 14 of the 25 ends they played without hammer (56%); similarly, Laurier stole points in 14 of their 29 ends without hammer (48%).
So in terms of Steal Defence, the top teams in the event all had Steal Defence values below the median of 0.35, led by TMU at 0.15 and followed closely by Laurier, Queen’s, and McMaster at 0.26-0.28. The teams with the worst win-loss records were unsurprisingly higher. In contrast, at the 2025 Scotties, Team Rachel Homan had a Steal Defence of 0.04 (4%).
Without additional information, such as player shooting statistics, it is difficult to conjecture as to why the Steal Defence numbers are so high. Possibilities include (1) the team is unable to execute sufficiently well to setup ends, (2) it signifies an aggressive, score-first style of strategy that backfires, (3) a team’s difficulty in throwing hit weight accurately, (4) being unable to defend against the 5-rock FGZ rule – or a number of other possibilities. Steal Defence alone doesn’t offer an explanation, but higher values should be considered a red flag.
Steal Efficiency and Force Efficiency
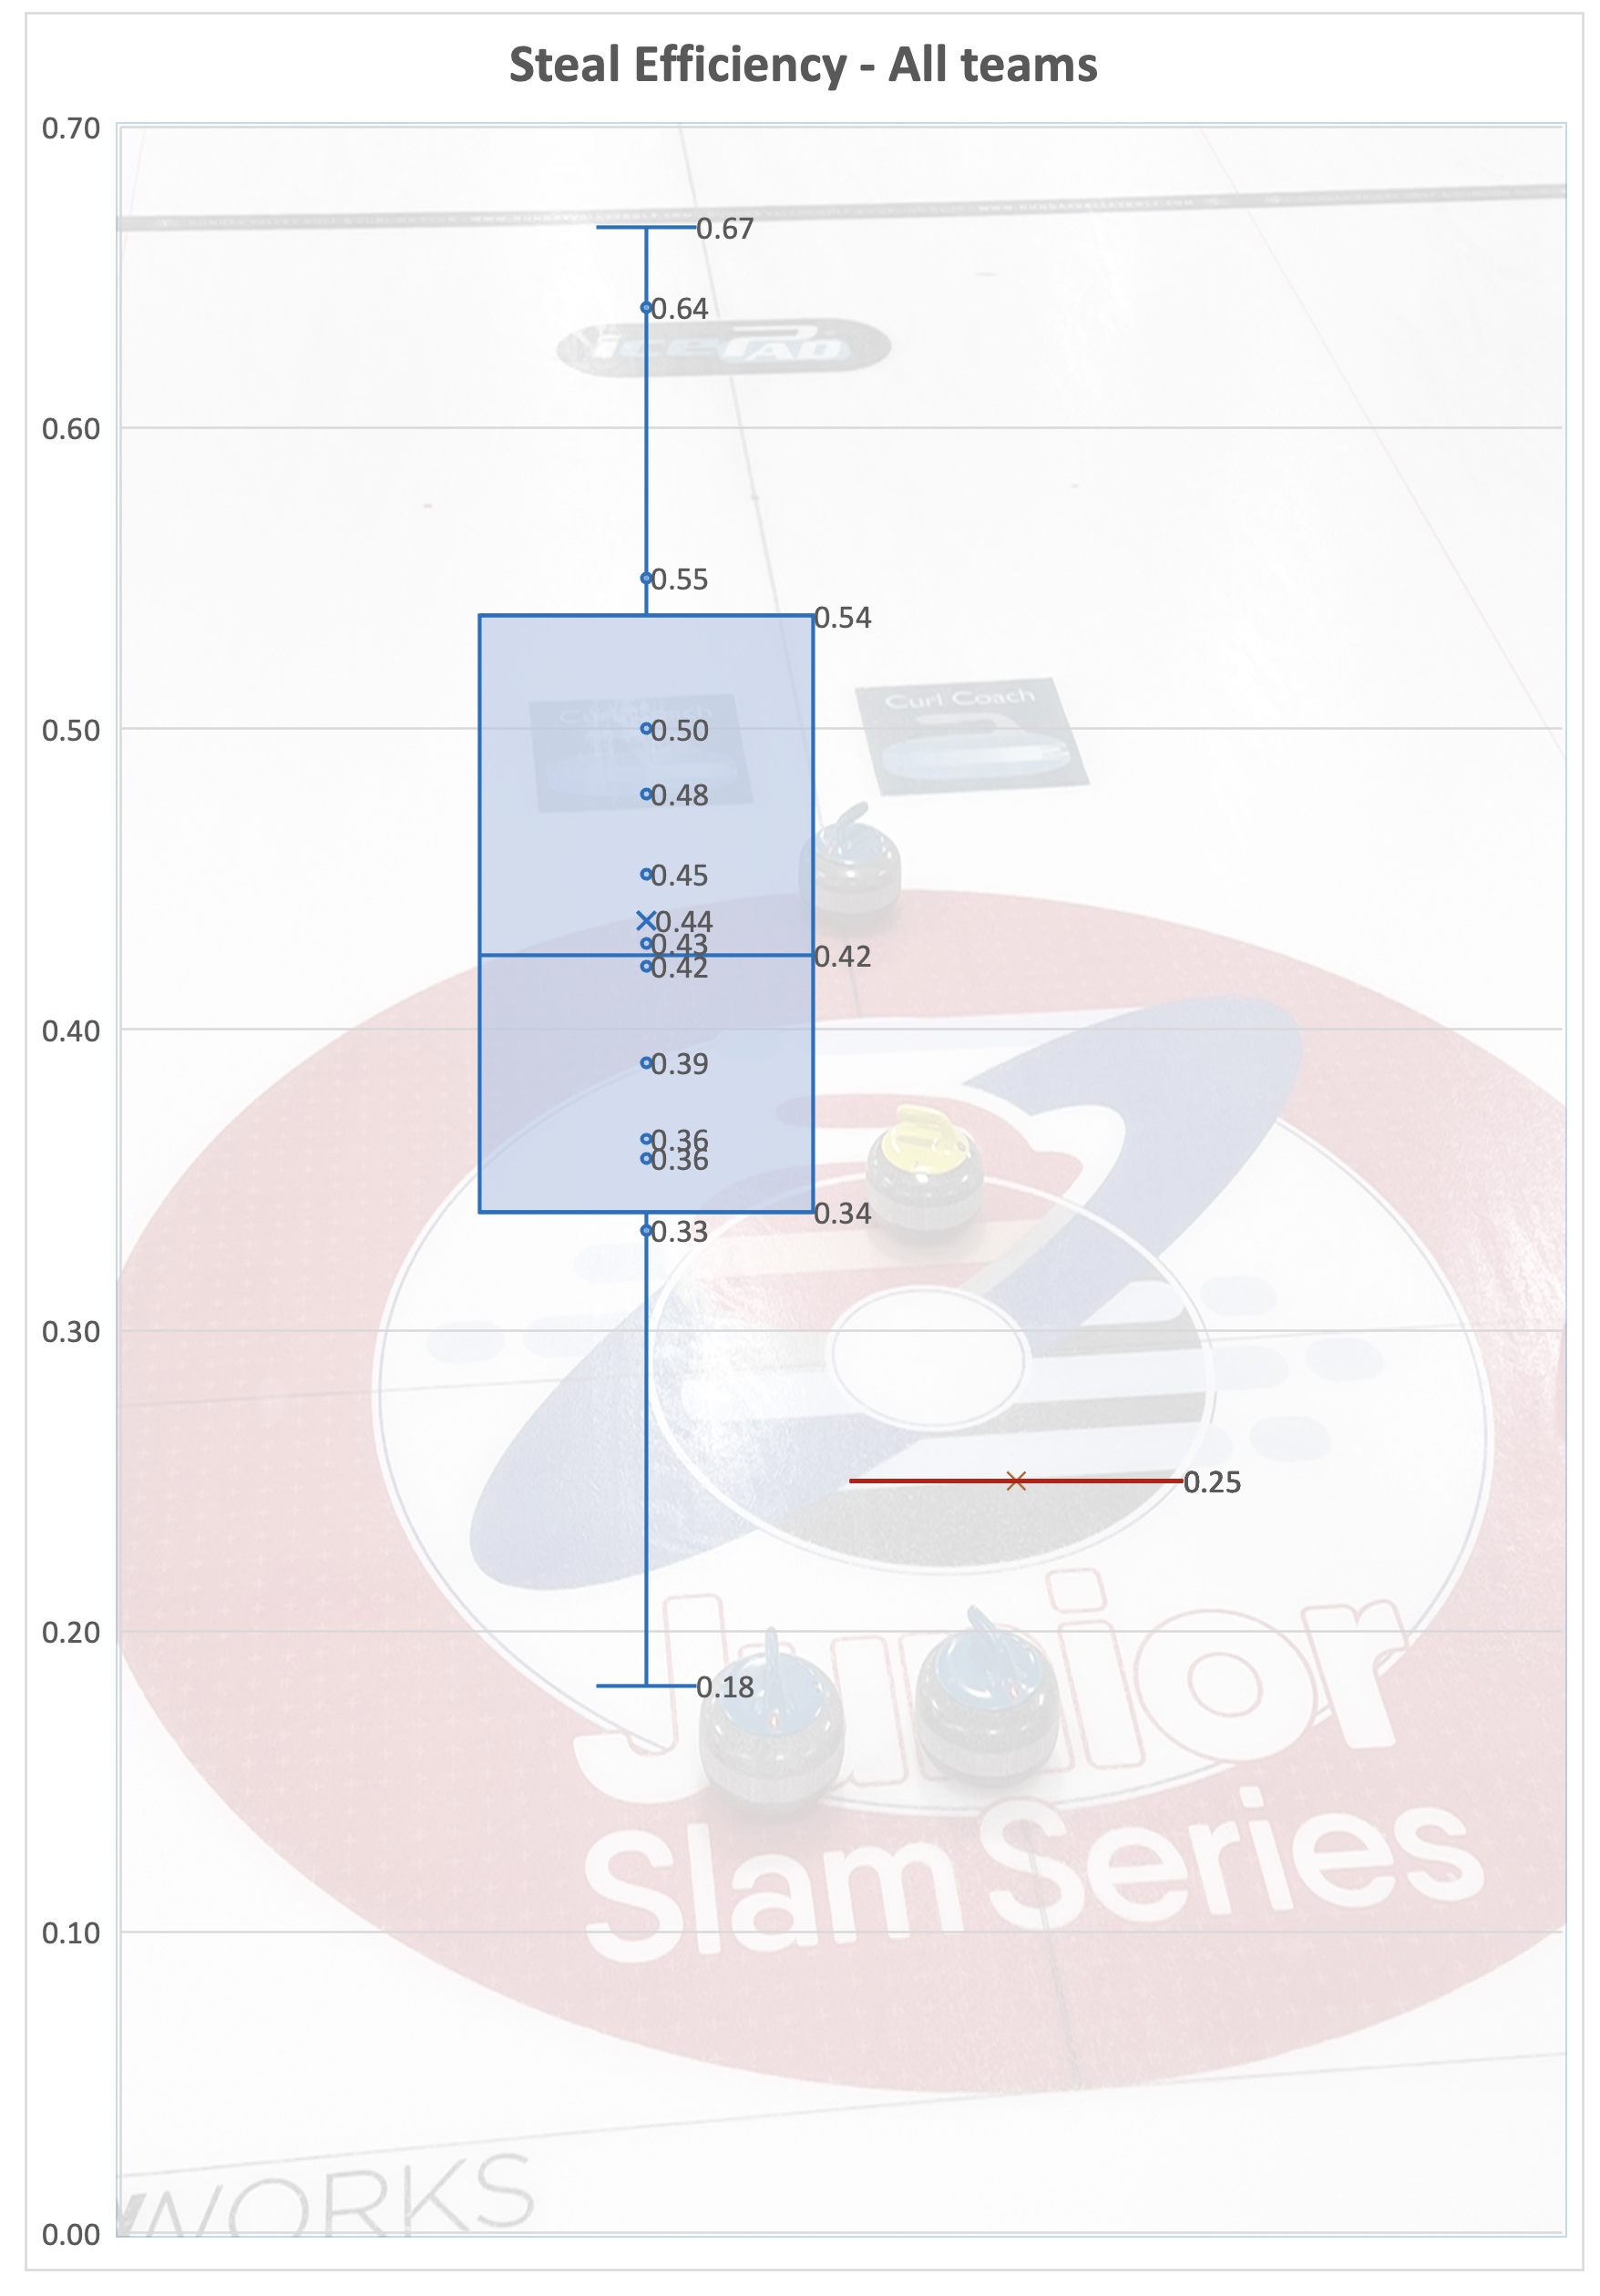
The applicable metrics for when a team does not have last rock advantage are Steal Efficiency and Force Efficiency, the latter being the percentage of time a team can force their opponent, with hammer, to settle for a single point. As mentioned above, there was a lot of stealing at OUA’s. These metrics are displayed in the charts below, again accompanied by the median value (the adjacent red line) from the 2025 Scotties’ championship.
Once again some additional context is essential when assessing a team’s performance with these metrics with such a small sample size. Windsor’s Steal Efficiency, the highest in the field at 0.67 (67%!) is a case in point. As Windsor was in Pool A they played the four teams in Pool D: Algoma, UOIT (Ontario Tech), Queen’s, and Wilfrid Laurier. Windsor stole 5 points in 3 ends but still lost to Algoma 8-6, stole a single point in 3 of 4 ends to squeak out a 5-4 win against Ontario Tech, scored 5 of their six points, including a steal of 3 in the final end, to surprisingly defeat Queen’s 6-5, but failed to steal a single point against Laurier, losing 10-1 in six ends. At 1-3, Algoma and UOIT were among the weaker teams in the field along with Toronto, York, and Western (Algoma had the lowest Steal Efficiency at 0.18).
At the elite level, stealing is much more difficult; at the 2025 Scotties the median Steal Efficiency was 0.25, with teams Homan, St Georges, Cameron, and Brown leading the way with Steal Efficiency values of 0.31, 0.39, 0.36, and 0.47 respectively.
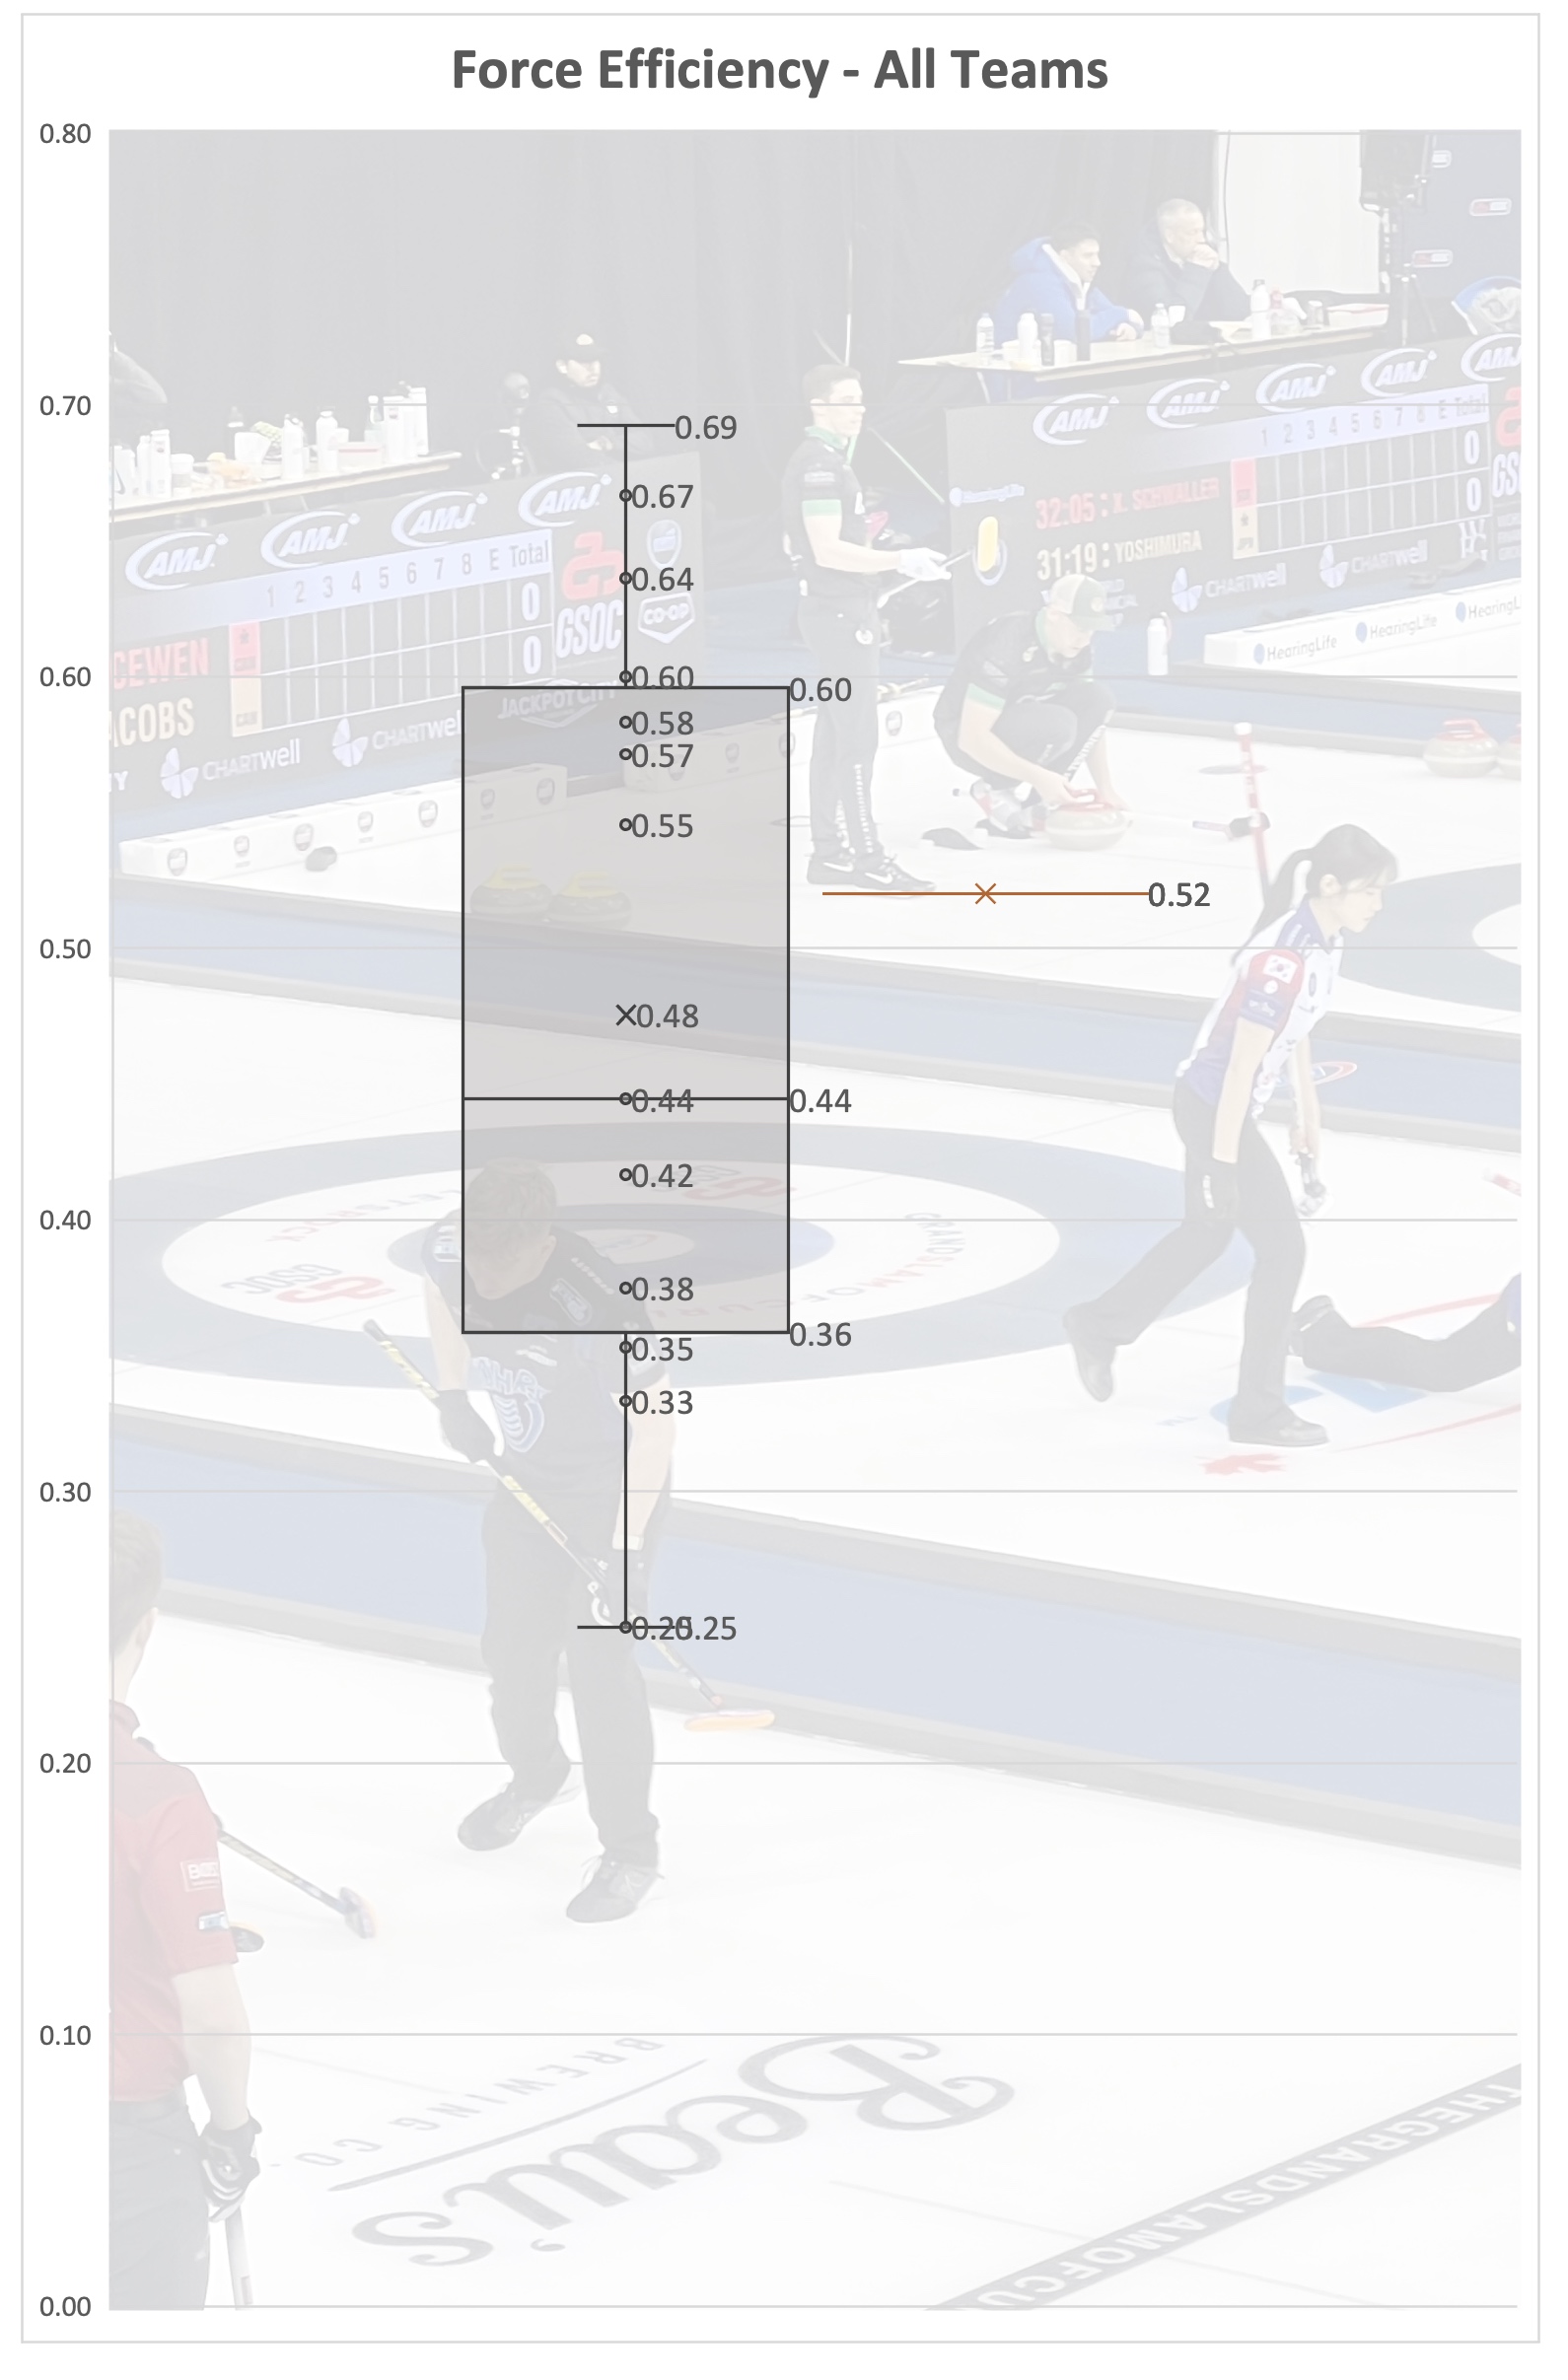
With Force Efficiency, the OUA teams exhibited similar performance to teams at the 2025 Scotties, with a median of 0.44 compared to the Scotties’ team median of 0.52. Again, however, additional context is necessary. Laurier had the best Force Efficiency at 0.69, followed by Algoma at 0.67, Laurentian at 0.64, and Windsor at 0.60. So Force Efficiency by itself is not a good indicator of team performance, at least with this (small) sample.
Combined Team Index
Thus far we have seen Hammer Efficiency as the most representative statistic to illustrate team performance, but even there the picture is incomplete. McMaster led the field with a Hammer Efficiency of 0.50, tied with Carleton, but Laurier earned the silver medal with a Hammer Efficiency of 0.29, lower than Brock (0.47) and Trent (0.42).
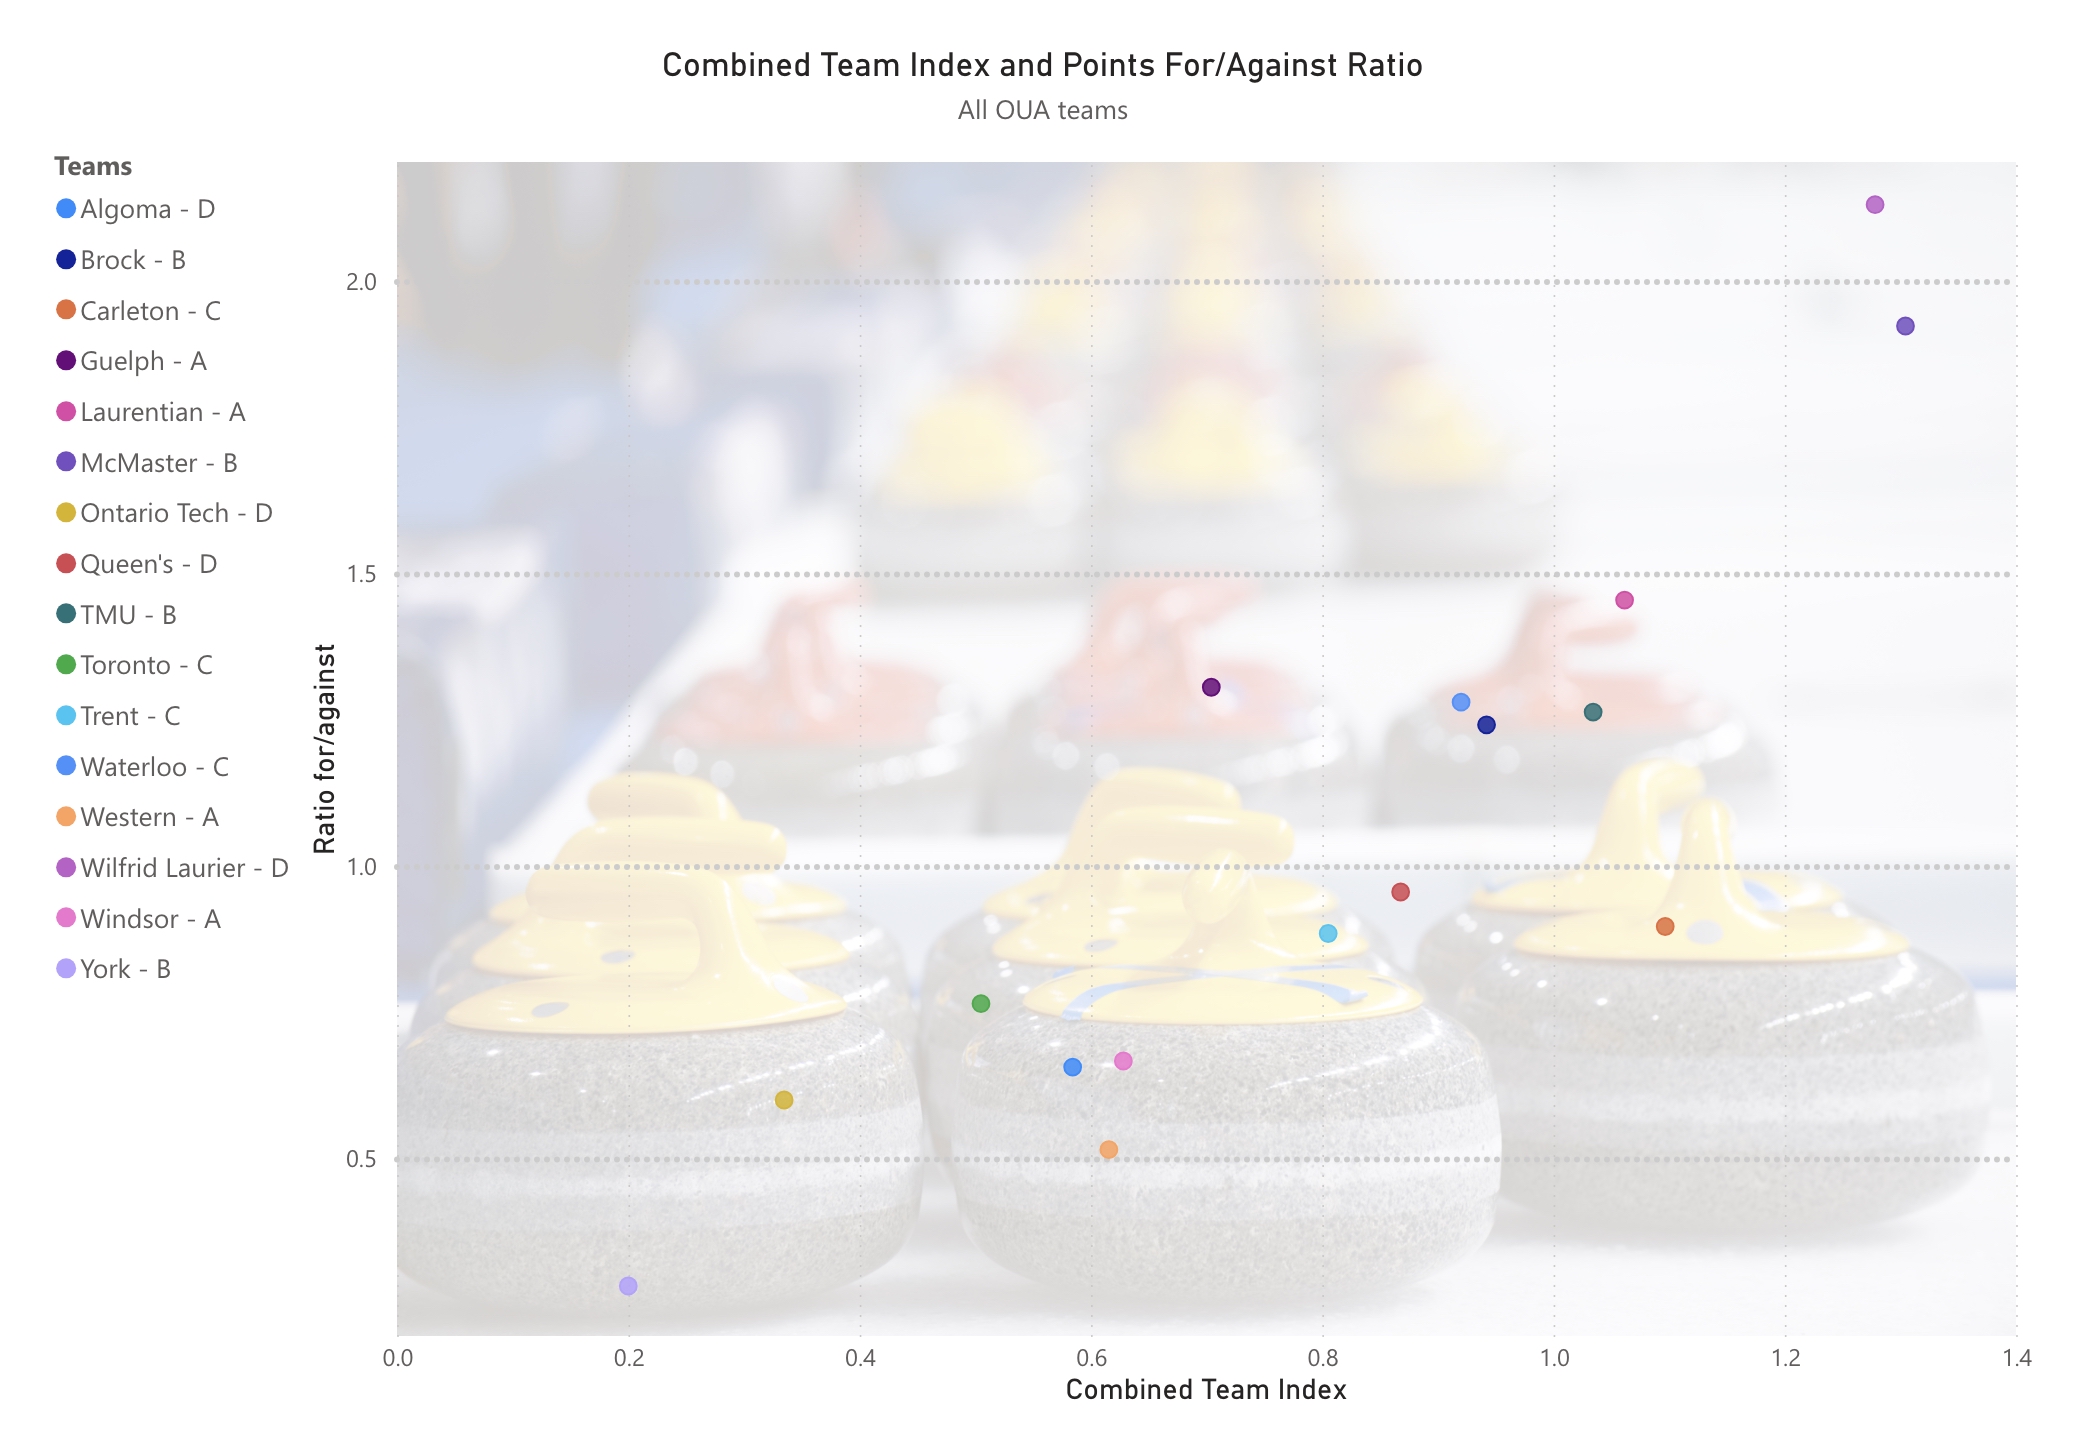
Above is a scatter plot that plots the Combined Team Index metric of all four metrics to their team’s points for/against ratio. As before, we use the points for/against ratio since teams played different numbers of games. (Aside: like the Hammer Efficiency scatter plot, this plot was generated with Microsoft Power BI).
This plot presents a much clearer picture of team performance at the 2025 OUA championships. Laurier and McMaster (upper right corner) lead the way, clearly better than the rest of the field. Bottom left, we have the weaker teams that finished at best 2-2 (Algoma, Windsor, Western, UOIT, Toronto, York) and the remainder of the field clustered in the middle. Despite that the OUAs constitute a statistically small sample of games, the Combined Team Index does appear to be a useful overall metric of OUA team performance, simply because it takes defensive measures (Steal Defence and Force Efficiency) into account along with a team’s ability to steal.
Summary
I apologize to the reader if they feel that I’ve taken them on a long statistical goosechase. However the metrics are useful indicators of team performance, as long as additional context is taken into account, as appropriate. Moreover, for a coach the scoring metrics by themselves do nothing to answer the “why” questions: Why is my team unable to score 2+ points with hammer? Why does my team give up so many points? Why is my team unable to steal consistently? The scoring metrics provide a clue, but only that. Game summaries, point scoring breakdowns, shooting statistics, and game video and/or game charting (I use Curl Coach) are all useful tools for understanding your team’s performance, and what one can address in practice.
Thank you for reading this far. You can download my Excel spreadsheet of the 2025 Ontario Women’s University Championship with this link. The spreadsheet includes a team summary, scoring summaries, and with/without hammer statistics along with the calculated metrics; a second tab in the Excel workbook contains the charts, except for the scatter plots which were done in Power BI. You can also download the results (again, an Excel spreadsheet) from the recent 2026 Canada West women’s university championship with this link.
Acknowledgements
I’ve illustrated the various analytic metrics using this case study of a single event in university women’s competition. I am not aware of a resource that summarizes team performance for U18, U20, or university events over a number of years so that one can compare one’s own team to historical norms. I hope to begin to do such a study over the summer months, time permitting.
Nevertheless, I would like to acknowledge and thank Dale Neufeld who has done the work to capture these various metrics for Grand Slam and various World Curling competitions, and make them available on his website, and which provides some needed context to understand the gaps between elite and junior/university teams.
I would also like to thank Dave Rapin of Curling I/O for his work in making scoring summaries and with/without hammer statistics available for events tracked on Curling I/O, which includes provincial/territorial and national championships in Canada. These event statistics enable the computation of the various analytics without resorting to tedious analysis of linescores, game by game.