In a previous article, John Newhook and I described ten reasons why the use of split times can be problematic for a team. Using interval, or “split” times, can benefit the delivering team because an interval time provides a proxy measurement for the velocity of a curling stone at the point of release. With an interval time, the two brushers can utilize the time to assist with their weight judgement, and the delivering player can use a split time to assist their delivery with respect to weight control.
One of the complications that we mentioned was that there is no straightforward, easy-to-compute mapping between split times and hog-to-hog times. Not only are interval times subject to user error, but the mapping between a split and a hog-to-hog time depends to a significant extent on a particular athlete’s delivery technique (rate of deceleration during the slide phase, and/or an accompanying arm extension, to name but two variables), ice conditions (the coefficient of friction of the ice along the stone’s trajectory), the roughness of the stones’ running bands, and the mass of the curling stone. A stone’s mass is important since a heavier stone will have greater momentum during its travel down the sheet.
Nonetheless we are often asked if there is anything beyond anecdotal rules of thumb that teams, particularly junior teams, can use to practice their weight judgment skills or provide useful input in a game situation. I received one such question from Garret Dillabough of Calgary (via University of Saskatchewan professor Sean Maw) this past January. At the time, I was unaware of anything in the literature (or in any coaching manual) that discussed split-to-hog-to-hog mappings. However, some very recent work by researchers in Japan and China provide a terrific starting point.
A Systematic, Mathematical Approach
In [3], Sonobe et al. derive mathematical relationships between back-line to hog-line intervals and hog-to-hog times based solely on the estimated rate of deceleration of a curling stone (see figure at right). Their mathematical model makes a number of simplifying assumptions, the most important being that the rate of deceleration of a curling stone remains constant. We know that this isn’t actually true (read further below) but since the hog-to-hog measurements cover the period when the stone is moving with the greatest velocity – and most importantly does not include the time where the stone slows as it enters the rings – the constant deceleration is a helpful assumption.
This mathematical model in [3] is not the primary focus of the paper, as Sonobe et al. are actually interested in measuring the effect of brushing. As brushing lowers the coefficient of friction of ice through heating, hog-to-hog times will lengthen with brushing, but those effects are not part of their model.
More on the brushing results in [3] will appear in a subsequent article.
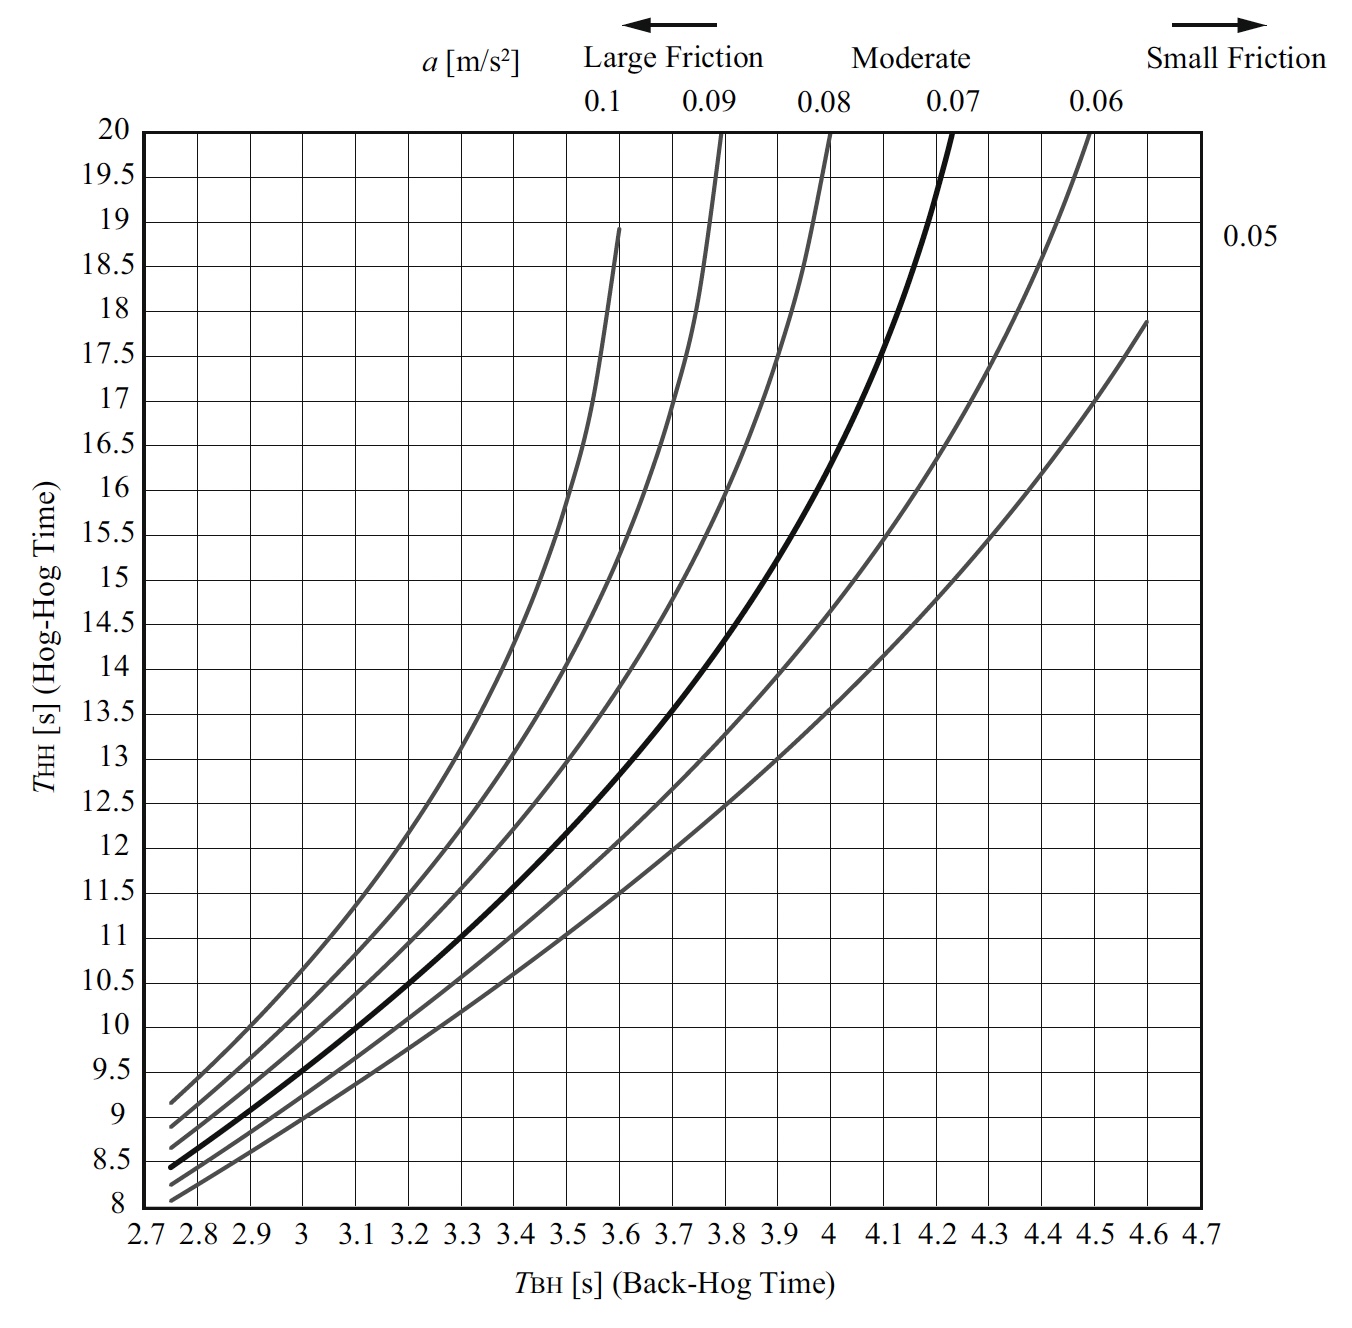
Figure 1. Plot of back-line to hog-line interval times (X-axis) to their corresponding hog-to-hog times (Y-axis) for six different ice conditions. From Figure 1(II) of Sonobe et al. [3].
Note: the mapping goes both ways: from a hog-to-hog time, one can determine the corresponding split time for a given deceleration constant (a = metres/second squared) along a specific trajectory.
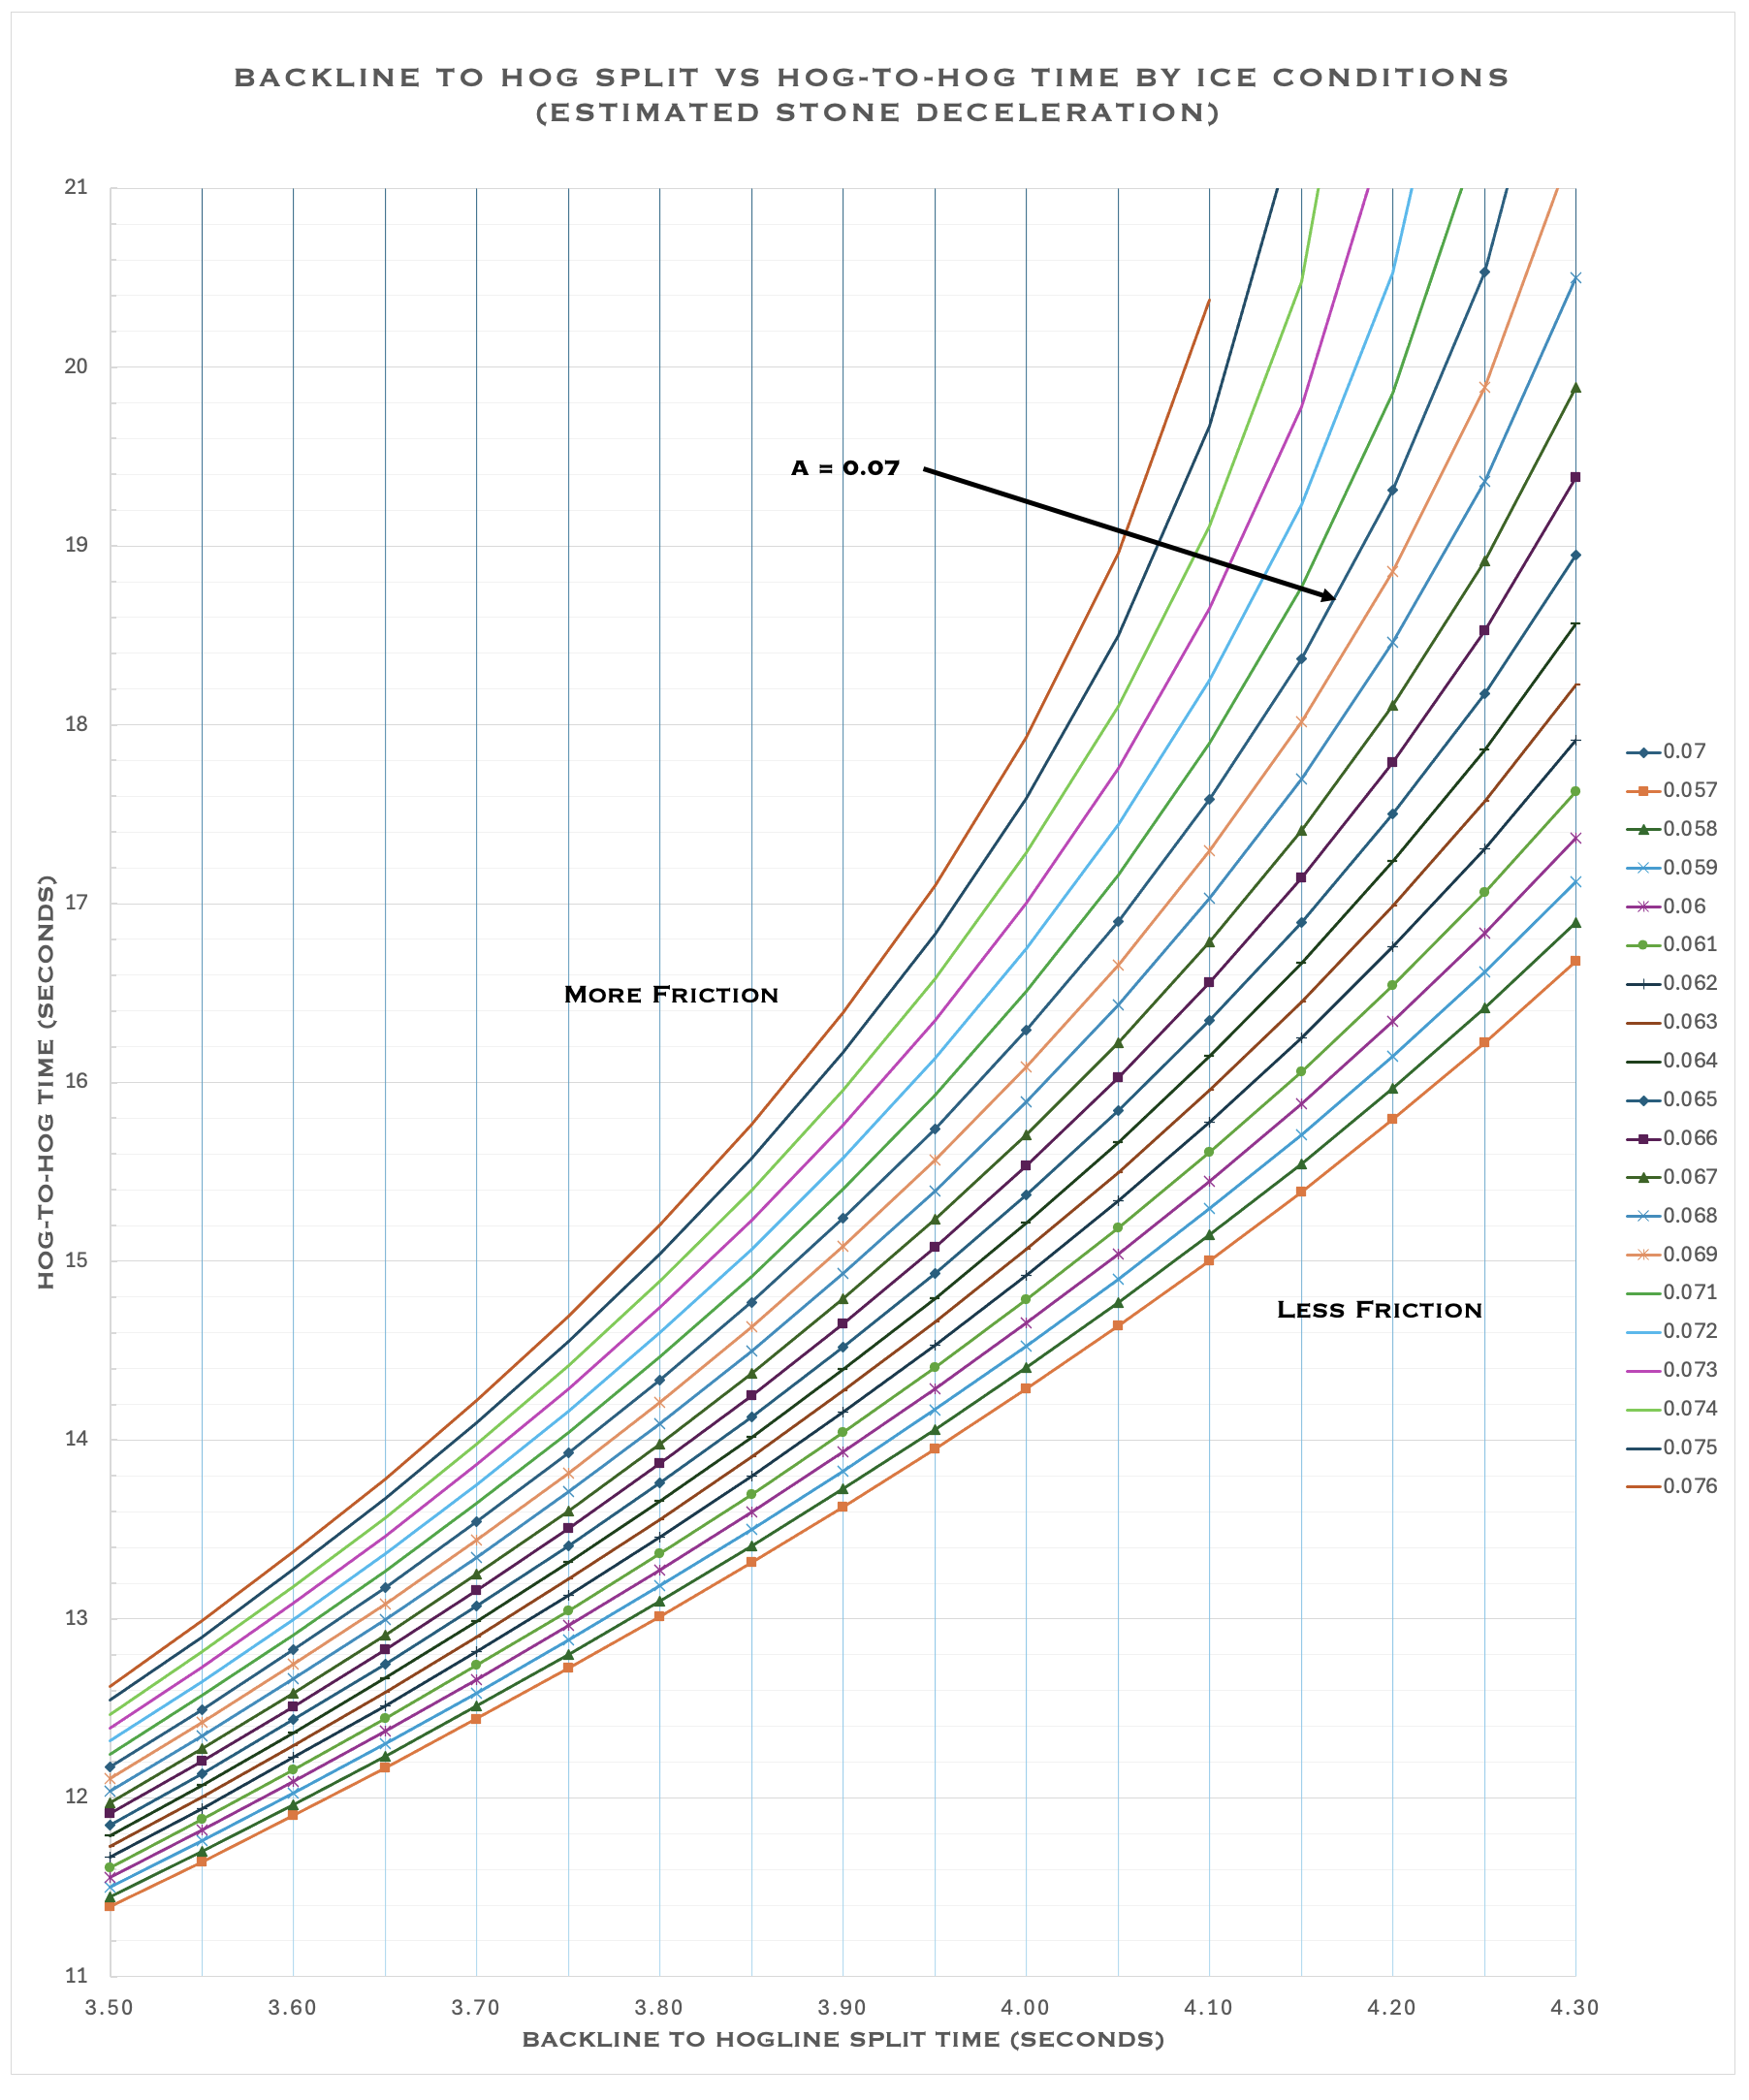
Figure 2. A regression of backline-to-hogline splits to hog-to-hog times that reflect typical ice conditions encountered by recreational and competitive players.
The chart above (Figure 1) from [3] nicely illustrates the differences in the mappings between backline-to-hog splits and hog-to-hog times, but several of the outlier curves (eg. a = 1.00 or a = 0.50) represent ice conditions that very few players will encounter in ordinary play, either at the club level or on arena ice.
At left is a similar chart which illustrates the differences in the mappings for split times between 3.5 and 4.3 seconds at ice conditions close to the ‘nominal’ deceleration of 0.07 m/sec^2 stated in [3], which gives a hog-to-hog time of 14.33 seconds for a 3.8 split. My chart at left contains curves for deceleration values between 0.057 and 0.076, which are much more likely to be experienced by both competitive and recreational players than the conditions modelled by the curves in Figure 1 above. Nevertheless, note how the regression curves are not linear; each curve becomes more exponential as the amount of friction on the ice increases.
The complete Excel spreadsheet that contains the data values and the chart in Figure 2 at left can be downloaded here.
Quantitative data to support the mathematical model
A year earlier (2023), and in an unrelated work, Yang et al. [4] looked at actual stone trajectory data from the 2022 Beijing Olympic Games and the 2021 World Curling Wheelchair Championships using a sophisticated video analysis capture system called CurlingHunter.
Video capture of games from the Olympics and Wheelchair World Championships were analyzed using AI and resulted in the 110,000 data points shown at right in Figure 3. This is very noisy data for several reasons: deceleration coefficients for a sheet change frequently through a game or from game to game; two ice-rinks were analyzed together; and tracking errors all contribute to errors in deriving the instantaneous coefficient of friction for a stone moving during a shot.
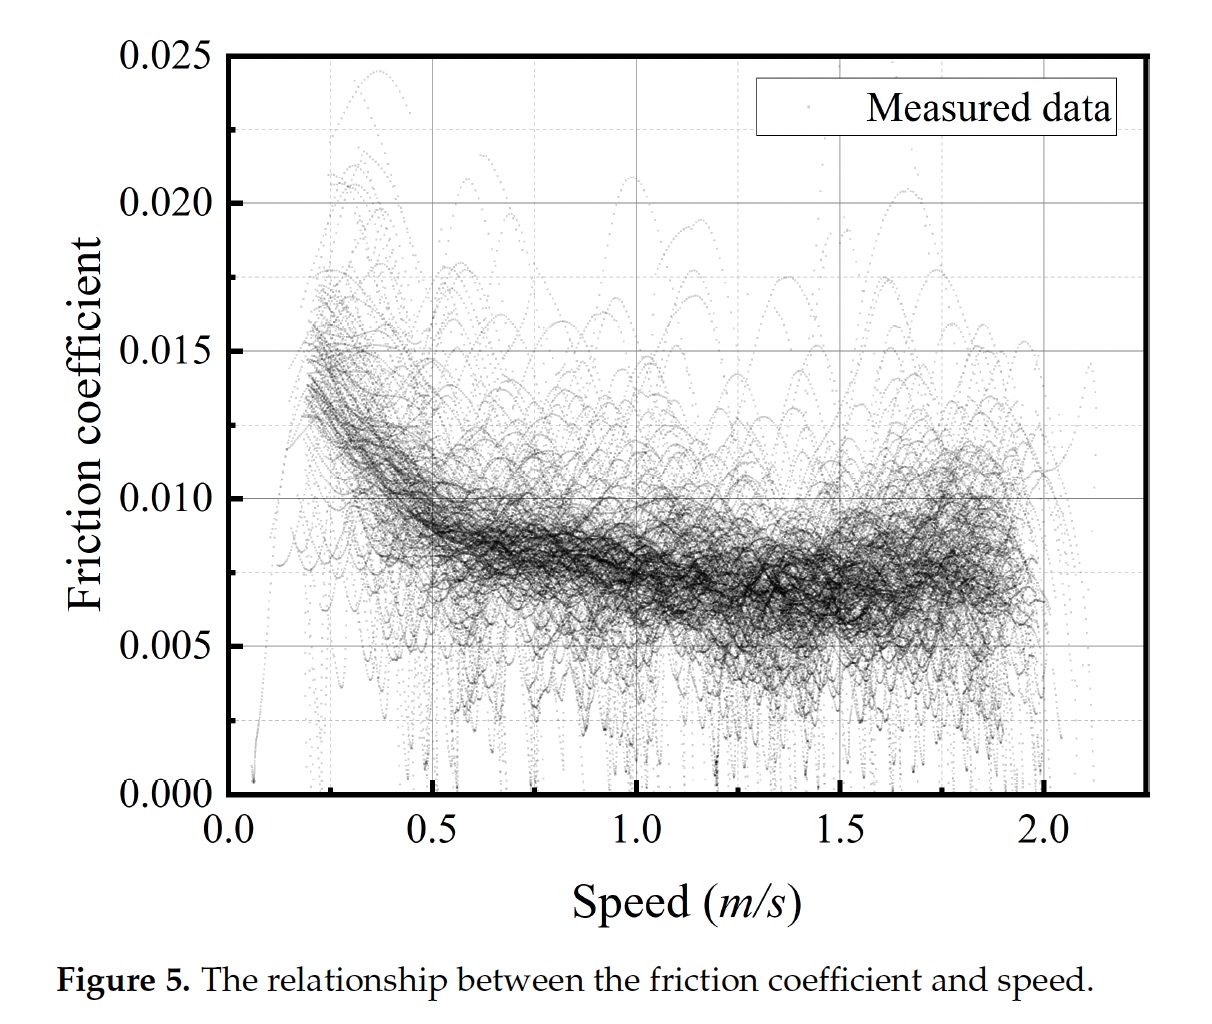
Figure 3. A regression plot of video capture data that relates the friction coefficient of the ice to curling stone velocity. The data (Figure 5 in [4]) comes from an accumulation of 110,000 data points taken from the 2022 Olympics and the 2021 World Wheelchair Championships.
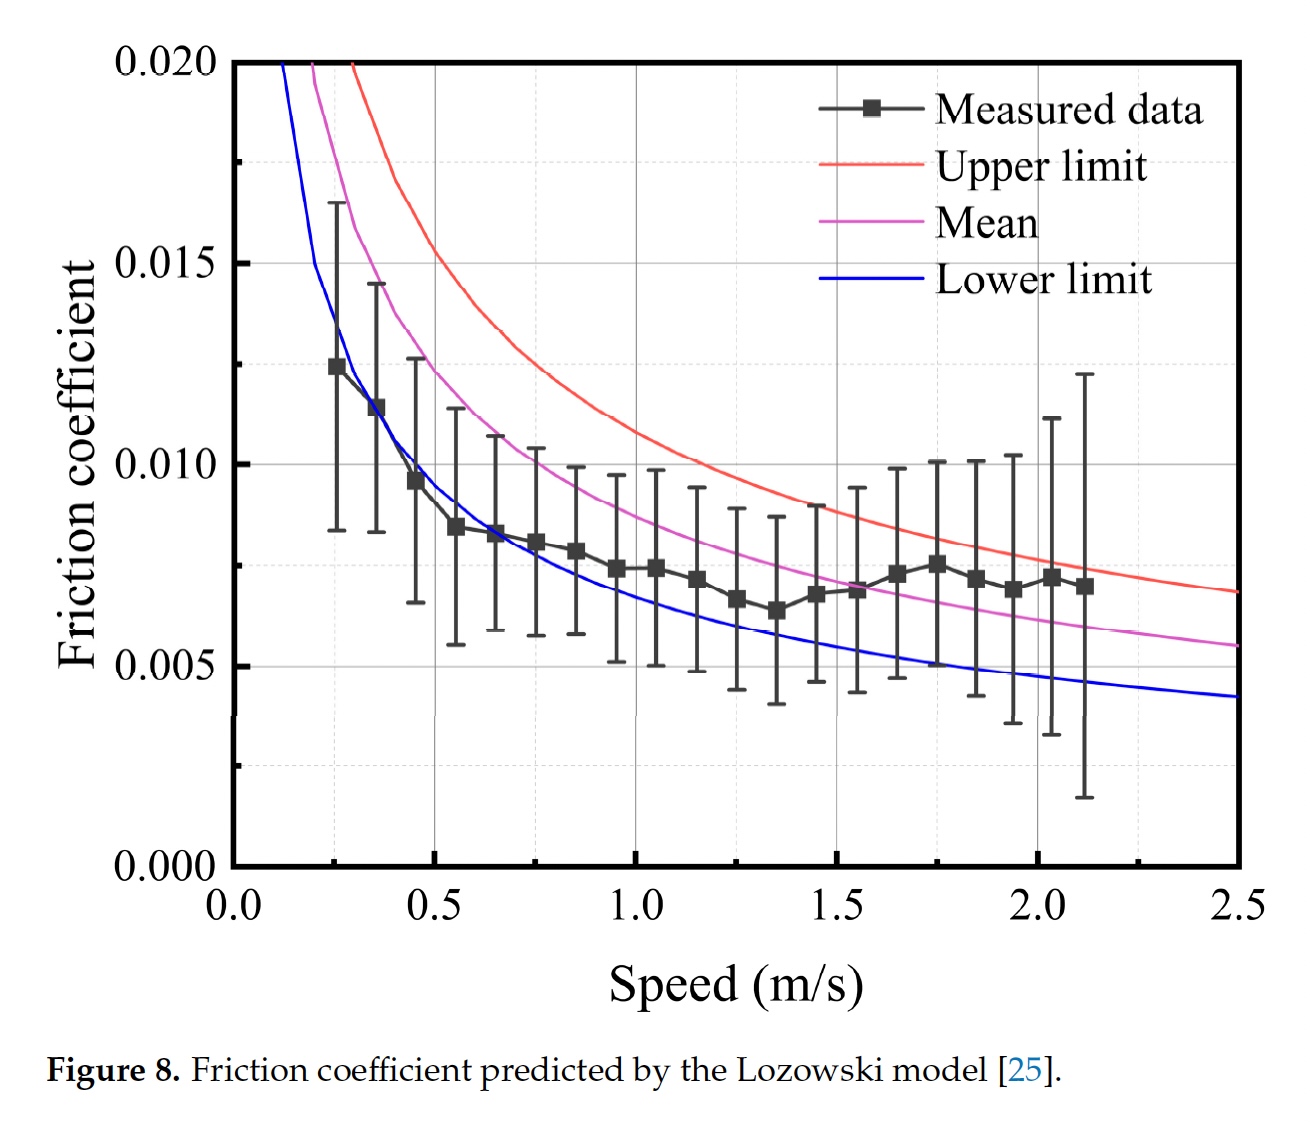
Figure 4. A plot of mean friction coefficients with error bars that summarize the data from Figure 3 above, overlaid with friction coefficients predicted by a model by Lowzowski, Szlider, Maw, et al. in [5].
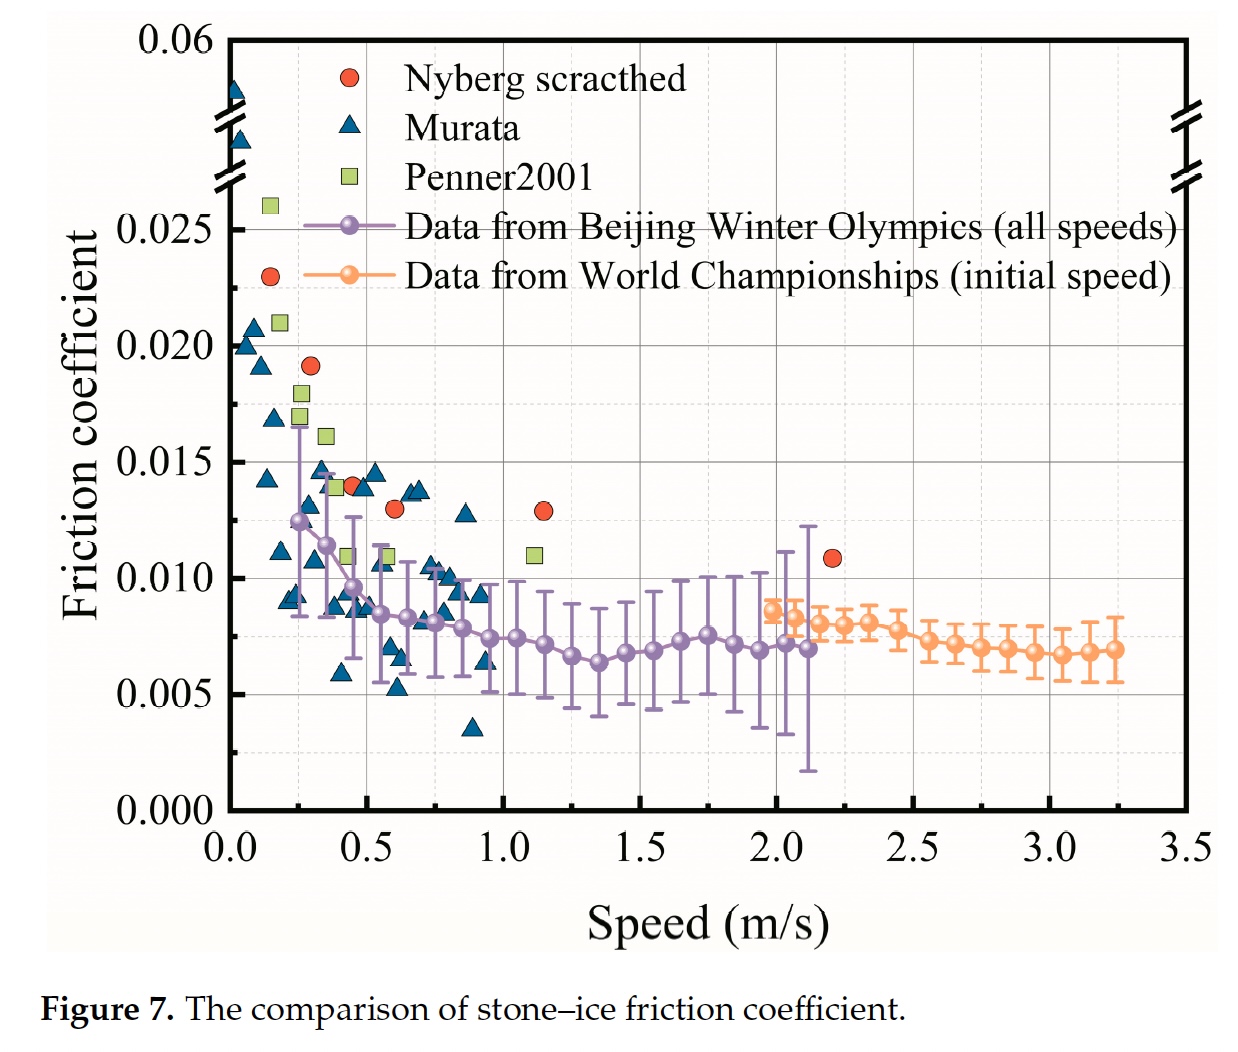
Figure 5. A plot of friction coefficient data that combines the observed data from China with prior work, including the mathematical model of curling stone dynamics proposed by Murata in reference [2].
The noisy raw data from Figure 3 above was then analyzed statistically to derive the coefficient curve shown above in Figure 4. Note the relative wide error bounds. Nonetheless the trend line for the friction coefficient derived from the observed data in China appears to be in good agreement with the mathematical model proposed in [5]. In Figure 5 (above, right), Yang et al. combine their results with theoretical data from prior work, again illustrating good agreement with their mathematical models.
Conversion of friction coefficients to time
Yang et al. then provide illustrations of the hog-to-hog times present at the Beijing 2022 Olympics, relating hog-to-hog times to both a stone’s initial velocity (Figure 6) and a shot’s corresponding split time (Figure 7).
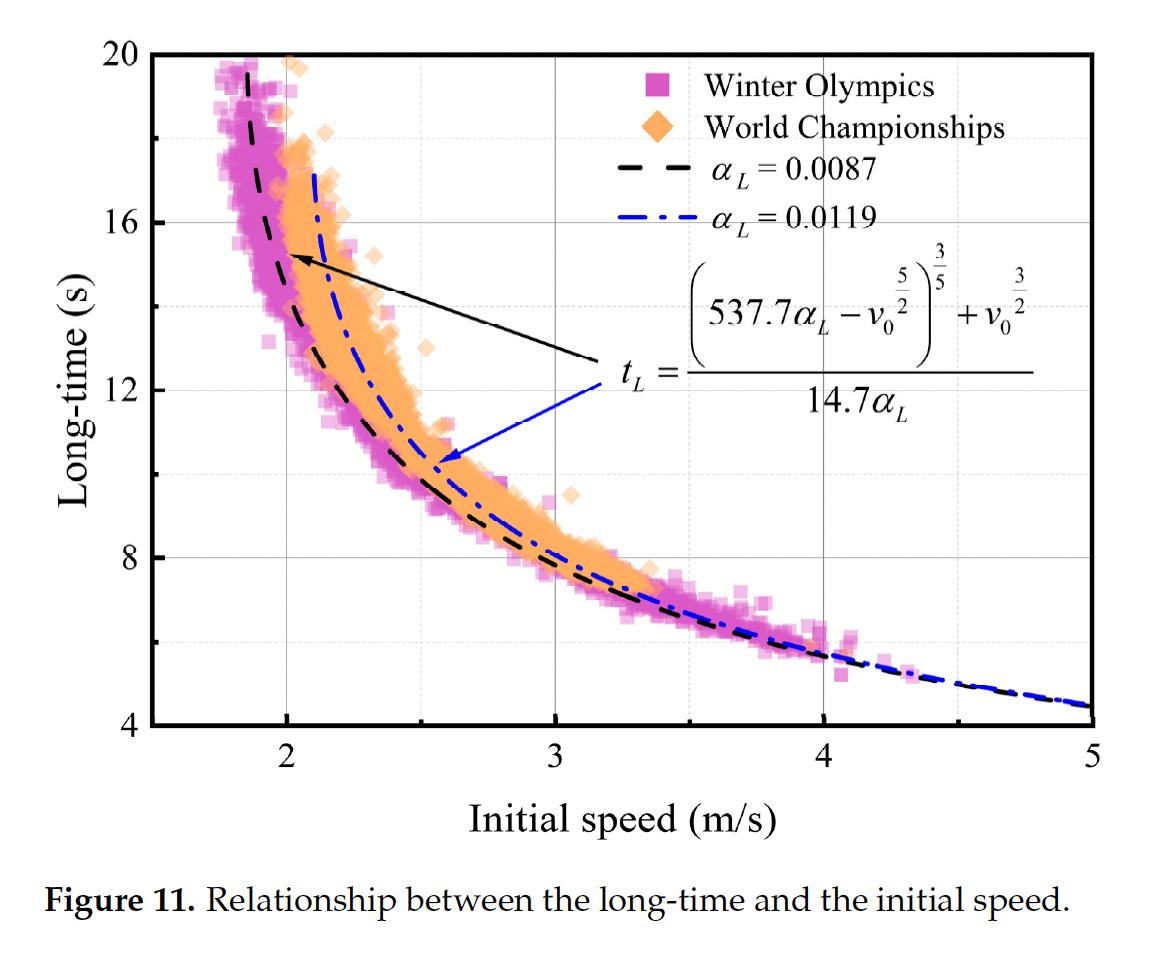
Figure 6. A regression of a stone’s initial velocity to the stone’s hog-to-hog time (termed “long-time” in reference [4]). The typical velocity of a stone at release for a draw-weight shot is between approximately 2.0 and 2.1 metres per second on decent ice.
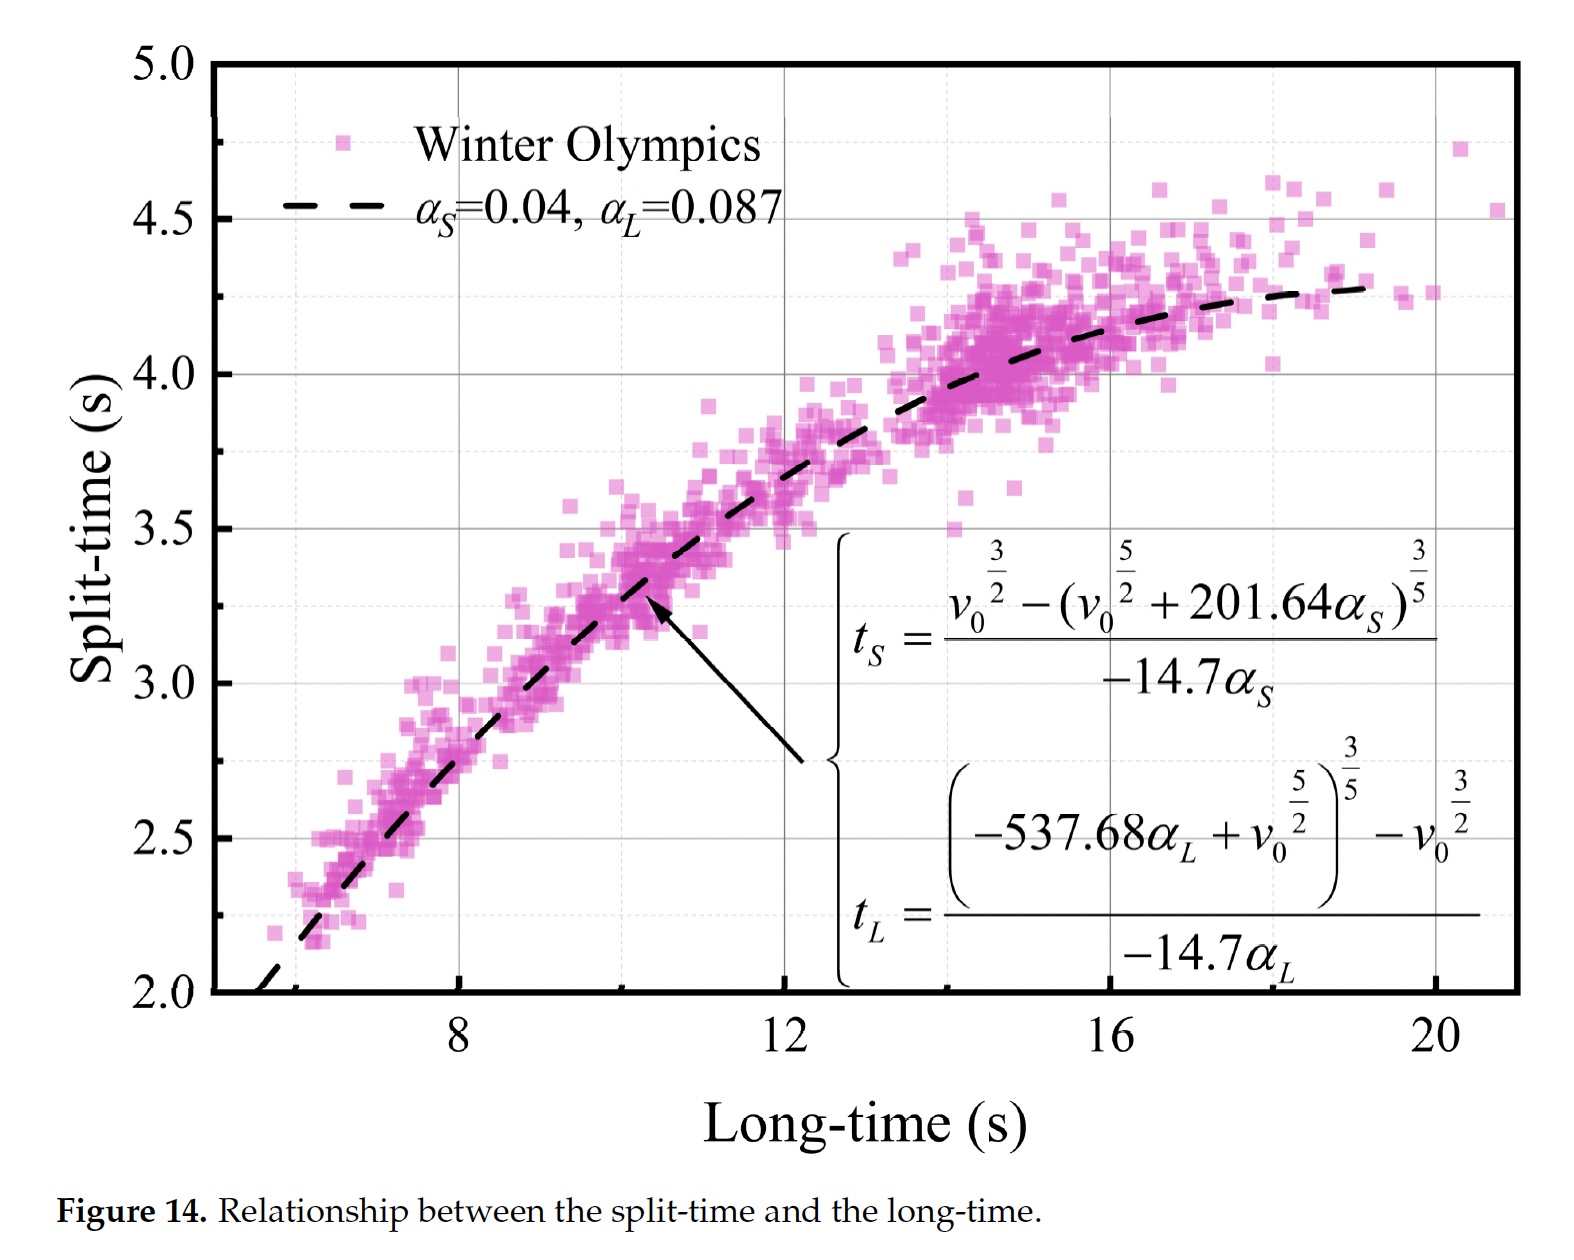
Figure 7. In [4] Yang et al. provide a mapping of backline-to-hogline splits to hog-to-hog time from two consecutive days (9-10 February 2022) of competition at the Beijing Olympics. The alpha measures in both Figure 6 and Figure 7 above are “quality evaluation indicators” and not friction coefficients.
From the clustering of the data in Figure 7, it would appear that many (draw weight) shots occur with a hog-to-hog time of around 15 seconds, which requires a split time of approximately 4.1 seconds. From Figure 2, that relationship would approximately fit a line with a deceleration coefficient a = 0.057, which represents very keen ice.
Summary
The foregoing discussion concerned only times. However, the point behind splits and hog-to-hog times is only to use them as proxy measurements for a stone’s velocity. Trying not to over-generalize (and everyone loves an over-generalization, do they not?) the player(s) use these estimates of velocity to then estimate the expected amount of curl (especially on hit-weight shots) and/or the stopping point of the stone (for draws and guards).
Sonobe et al. also provide a mapping of split times to distance in Figure 2 of their paper (Figure 8 at right), again charting multiple curves based on friction coefficients and highlighting the ‘nominal’ coefficient of a = 0.07. Once again, the extreme values of a are unlikely to be experienced by recreational or competitive players in today’s ice rinks.
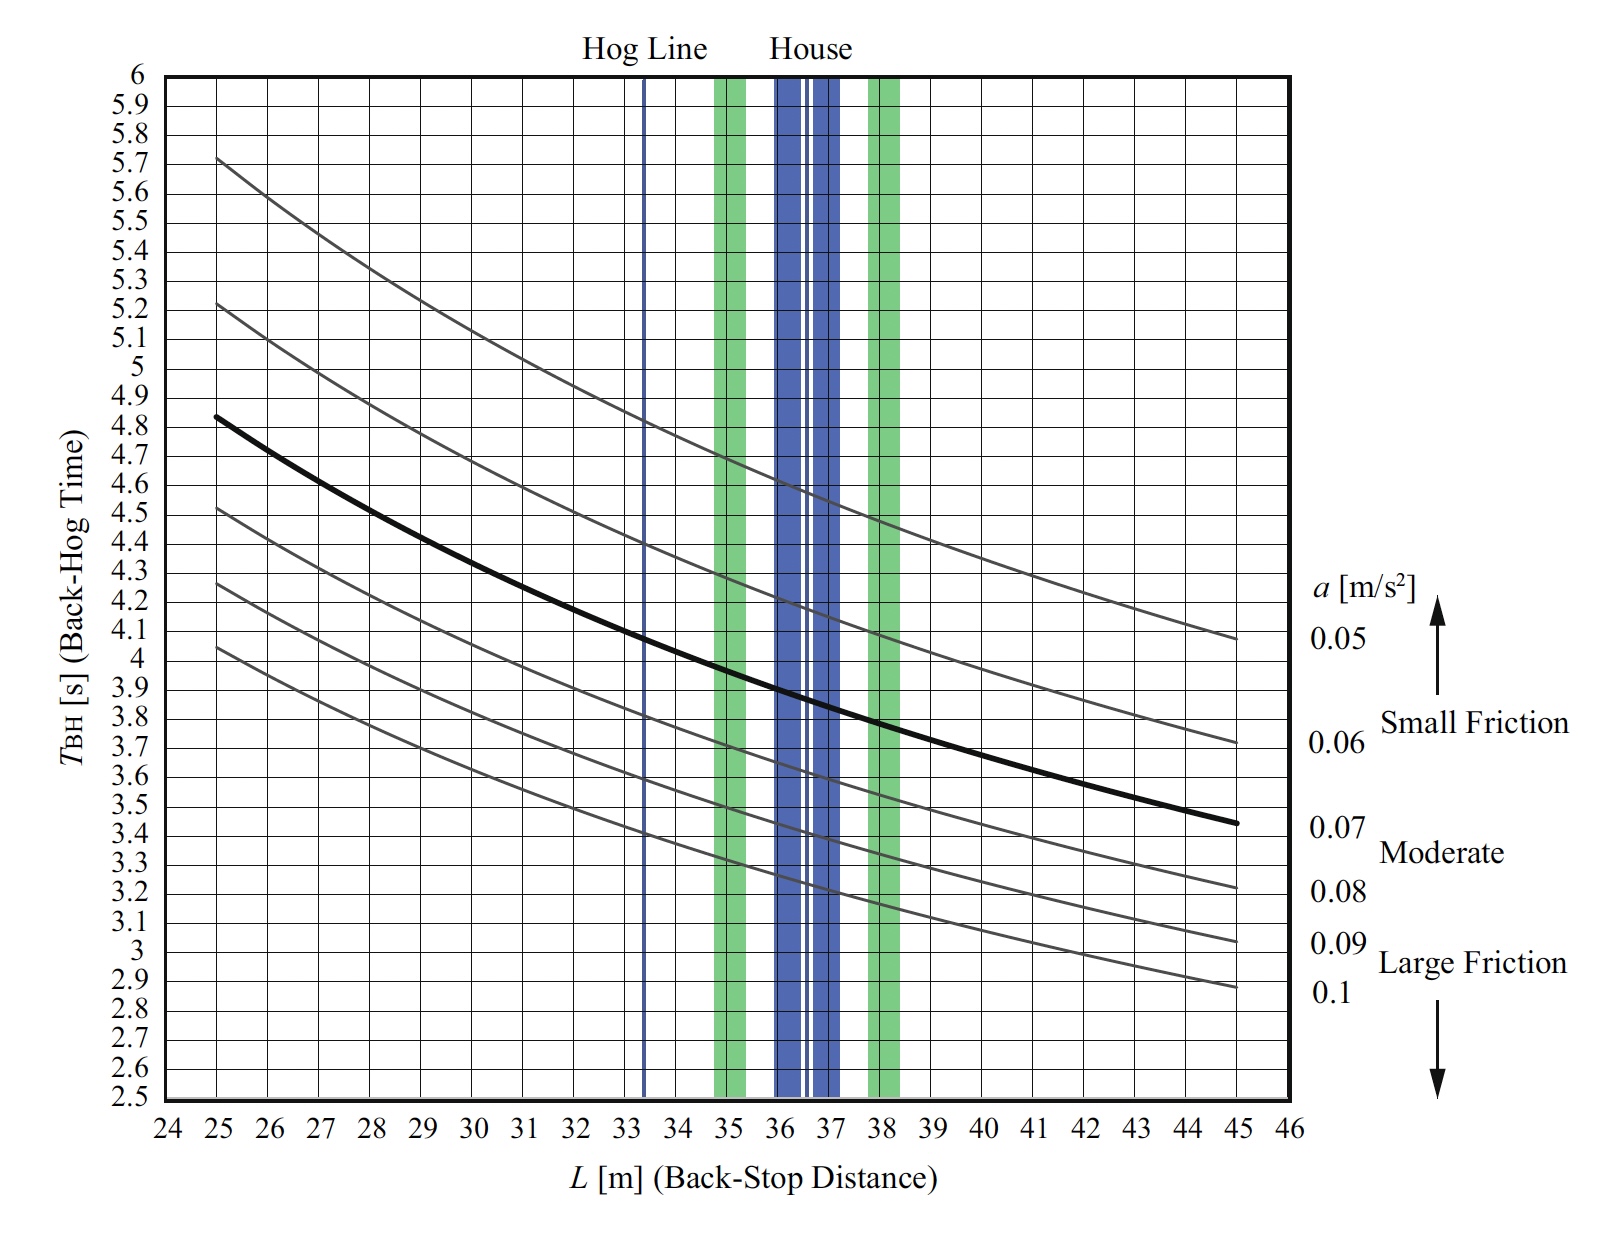
Figure 8, reproduced from [3] (Figure 2, page 4). This data also comes from the authors’ experiments at Karuizawa. As with the other images in this article, click on the image for an enlarged view.
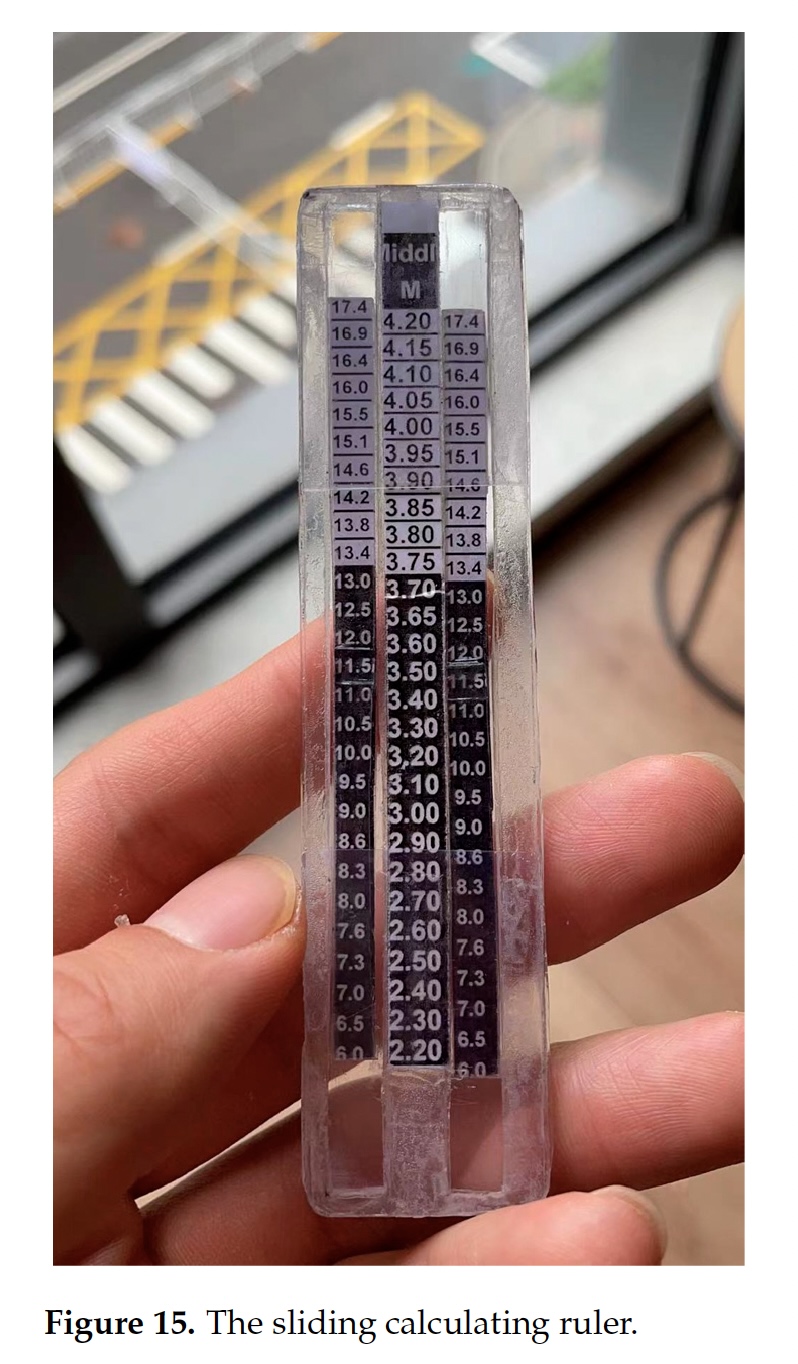
Figure 9. Image of a fabricated split-time to hog-to-hog time “calculator” to help novice athletes understand the relationship between splits and hog-to-hog times. The image appears in [4], page 18.
The challenge in the sport of curling is rock management: the ability of a team to manage the longitudinal and lateral motion of a curling stone through brushing in order to place the stone at exactly the intended spot, or to strike a stationary stone at precisely the right spot, and at the right velocity.
What makes this quite difficult is that through a game, and from game to game, the characteristics of the stone-ice interactions changes, due a variety of factors. Brushing lowers the coefficient of friction through heat, adding carry distance, but at the same time causes pebble abrasion that can impact subsequent shots on the same trajectory. Consequently teams must be keenly aware of paths in the ice and monitor them throughout a game. Sometimes the differences amongst paths are small; at other times, they can be quite significant.
Nonetheless, timing systems remain a valuable tool for rock management, especially for young players as they learn weight judgement skills. In [4], Yang et al. include a photograph, reproduced at left, of a prototype sliding “calculator” ruler that provides a mapping of splits to hog-to-hog times for two different sets of deceleration constants with similar characteristics (the paper does not state which constants are used to create each of the two outside columns). While experienced competitive teams use their weight judgement skills almost exclusively, such a tool may be useful for U15 or U18 players as they learn the sport.
In closing, we are beginning to see some excellent research in the academic literature, not only that moves the needle in our understanding of the physics of curling stones but also with respect to brushing [1-4]. More on this recent work in a subsequent article.
Bibliography
The four articles below are Open Access and are licensed under a Creative Commons Attribution 4.0 International License. Their content, and images within the articles, may be shared under Creative Commons. To view a copy of this licence, visit http://creativecommons.org/licenses/by/4.0/.
[1] Kim, T.-W., Lee, S.-C., Kil, S.-K., Choi, S.-H., & Song, Y.-G. (2021). A Case Study on Curling Stone and Sweeping Effect According to Sweeping Conditions. International Journal of Environmental Research and Public Health, 18(2), pp. 833. https://doi.org/10.3390/ijerph18020833
[2] Murata, J. (September 2022). Study of curling mechanism by precision kinematic measurements of curling stone’s motion. Scientific Reports 12, 15047. https://doi.org/10.1038/s41598-022-19303-4
[3] Sonobe, H., Aoki, Y., Miya, O. et al. (September 2024). Sweeping effects on curling and friction estimation. Sports Engineering 27 (31). https://doi.org/10.1007/s12283-024-00473-5
[4] Yang, Q., Li, S., Li, J., Zhang, W., Wang, Q., & Ma, X. (2023). Research on Evaluation Indicator of Ice Rink and Curling Stone Motion for the 2022 Beijing Winter Olympic Games Based on Video Recognition Method. Lubricants, 11 (9), pp. 370. https://doi.org/10.3390/lubricants11090370
Additional references:
[5] Lozowski, E.P., Szilder, K., Maw, S., Morris, A., Poirier, L., and Kleiner, B. (June 2015). Towards a First Principles Model of Curling Ice Friction and Curling Stone Dynamics. In Proceedings of the Twenty-fifth International Ocean and Polar Engineering Conference, Kona, Hawaii, 21–26 June 2015, pp. 1730–1738.
Very well thought out and detailed! I had no idea this kind of research was being done until now